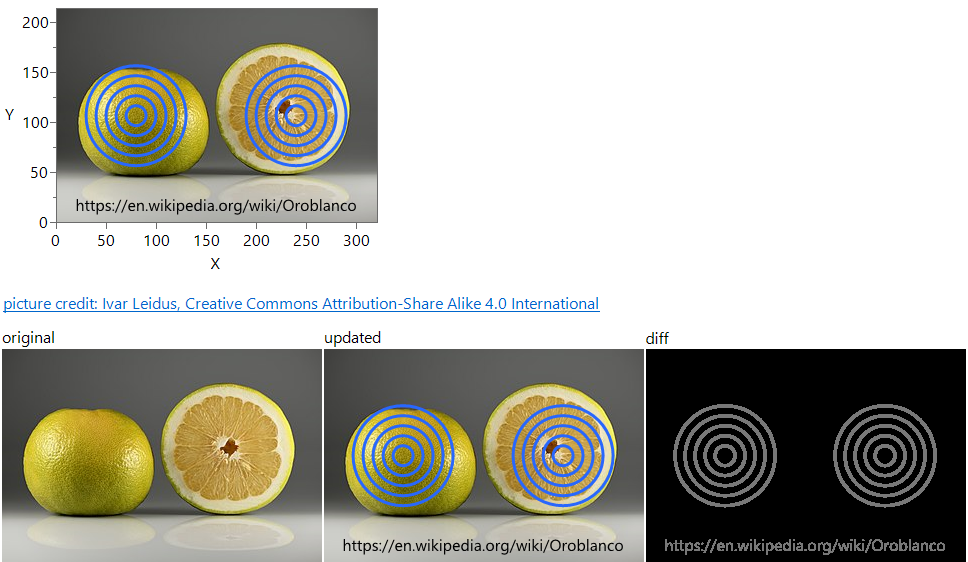
Using functional data as inputs instead of outputs
The Functional Data Explorer (FDE) in JMP Pro is generally used when the output of a process is functional/curved data. However, with a few tricks, functional data can also be used as an inp...
 Jed_Campbell
1250 views
|
1 replies
 Phil_Kay
 Bill_Worley
 DaeYun_Kim
 SamGardner
 gail_massari
 Valerie_Nedbal
 Richard_Zink
 KristenBradford
 Chris_Kirchberg
 cweisbart
 Paul_Nelson
 Craige_Hales
 anne_milley
 Di_Michelson
 JohnPonte
 Masukawa_Nao