 Hello! Welcome to today’s Need for Speed! Today is all about extracting summary statistics!
My name is 2-Click Clovis, and I am truly passionate about data analysis and most important, time efficiency!
JMP was an integral tool for my previous work in the semiconductor and manufacturing industries. Since joining JMP, I have learned so many new tips and tricks. I’ll never forgive myself for not knowing what I now know, because I could have saved so many hours in my data analysis workflow! I see it as my current responsibility to share with my newfound knowledge with all current JMP users to help them regain their precious time.
After I demonstrate how quickly JMP can perform your routine data manipulation and analyses compared to other tools, I’ll show you the quickest way to get it done within JMP.
Extracting Summary Statistics
I have some very serious questions for you:
- Are you manually typing formulas in your spreadsheets to extract column variable summary statistics, such as:
=Average(A1:A11)?
=Stdev(A1:A11)?
=Max(A1:A11)-Min(A1:A11)?
- Are you then copying and pasting or dragging these formulas to apply them to other columns/rows?
There is no judgment coming from me. For I, too, have done this in my past. I remember frequently wasting so much time, doing this repetitive, menial, and soul-crushing task. I am here to tell you…NO MORE!
JMP’s Tabulate platform solves all your problems with just two drag-and-drop clicks.
Tabulate platform
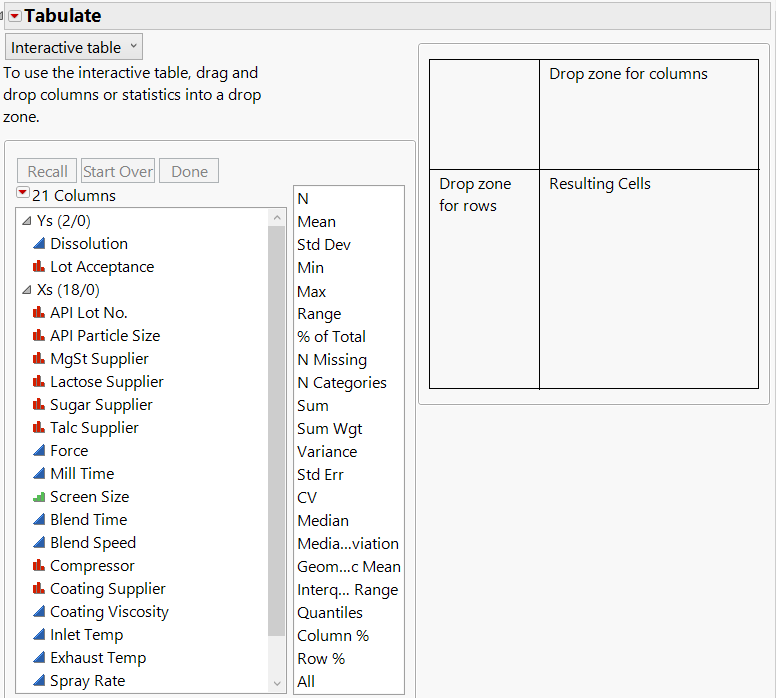
All you need to do is go to the Tabulate platform from the Analyze drop-down menu. When you do this, a new window appears. At the left of this window are all of your column names (containing all the rows of data associated with that column) and a comprehensive list of summary statistics. To the right of the summary statistics is an interactive table where you can drag and drop either your column names or desired summary statistics.

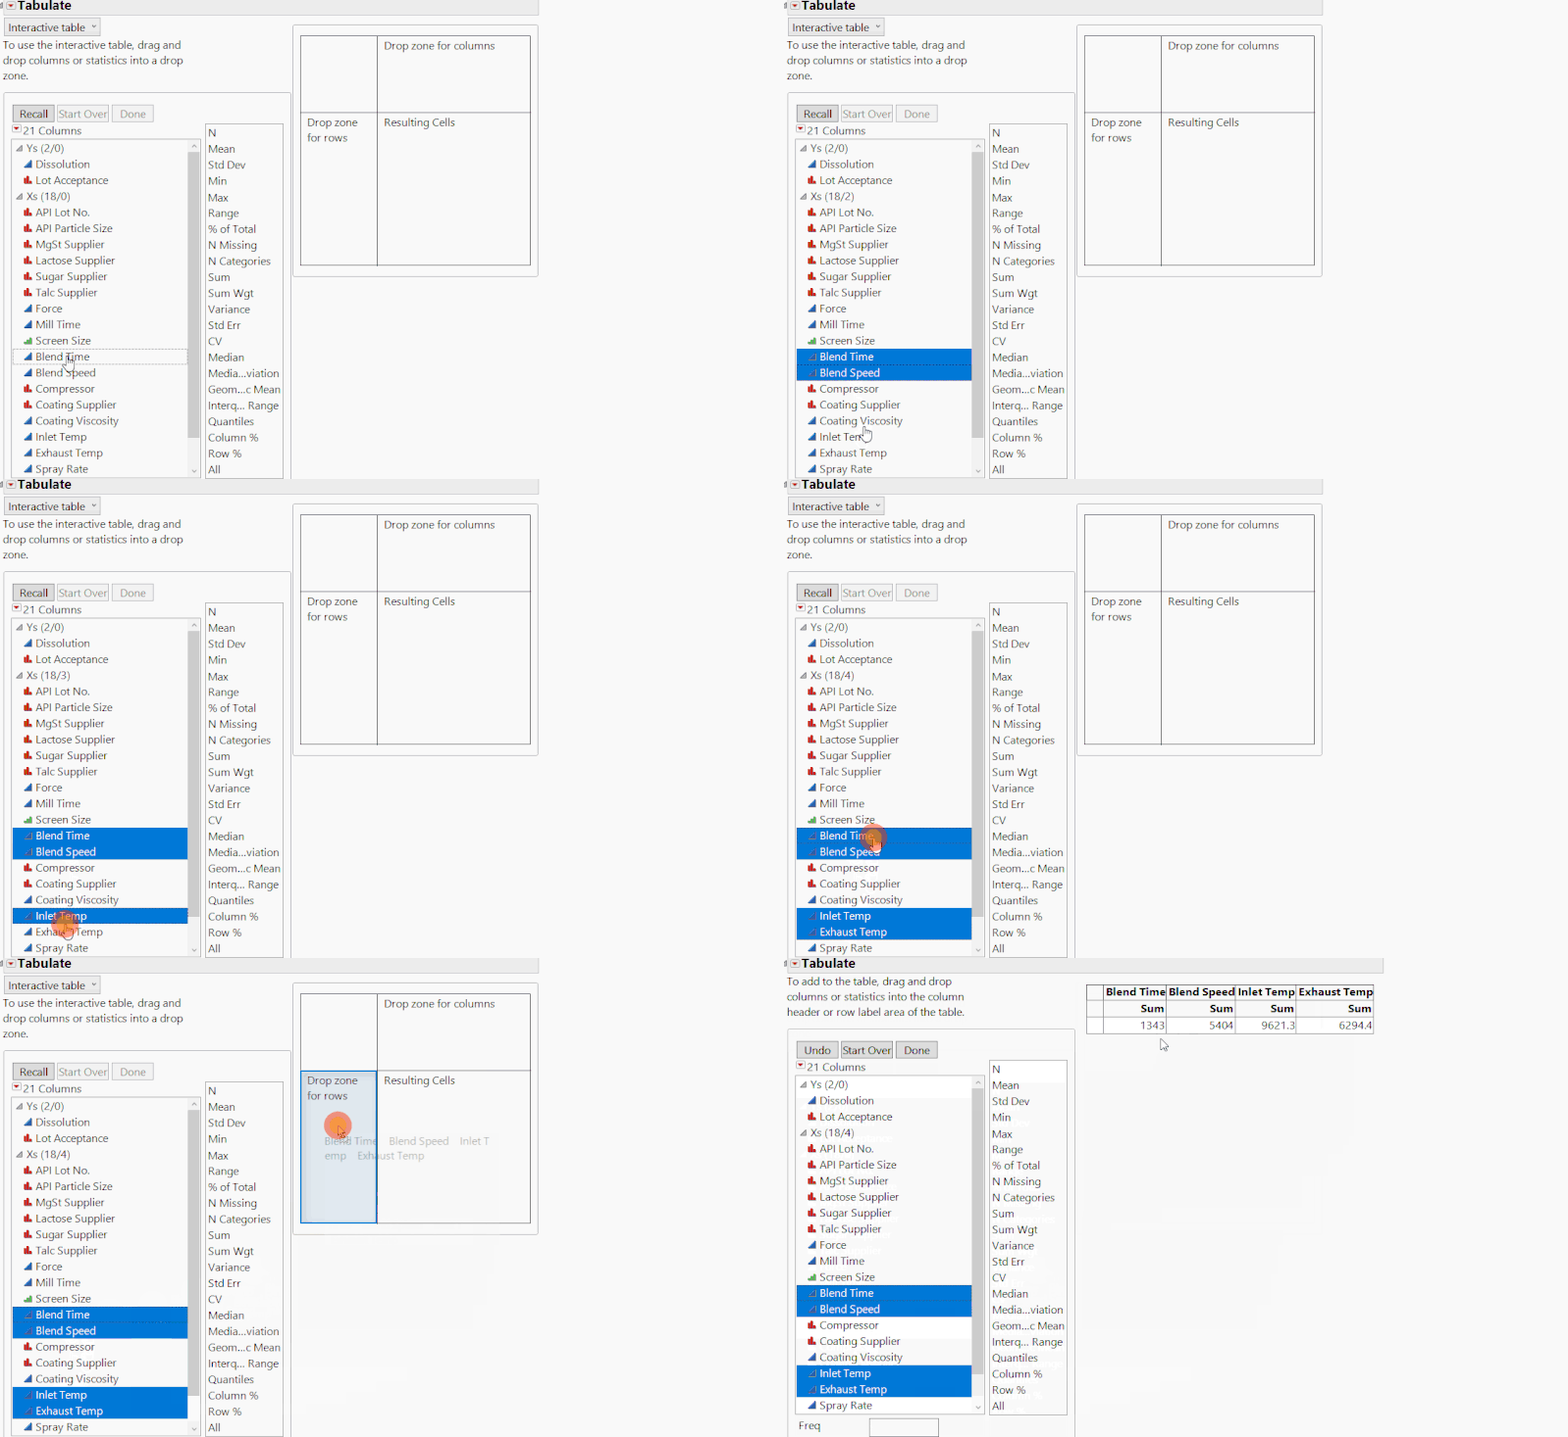
For your first drag-and-drop click, select your columns of interest and then drag and drop them to either the drop zone for rows or the drop zone for columns. The default summary statistic is Sum (adding all the values across all the rows within a given column). In the example below, after choosing Blend Time, Blend Speed, Inlet Temp, and Exhaust Temp as my variables of interest, I drop them in the drop zone for columns.

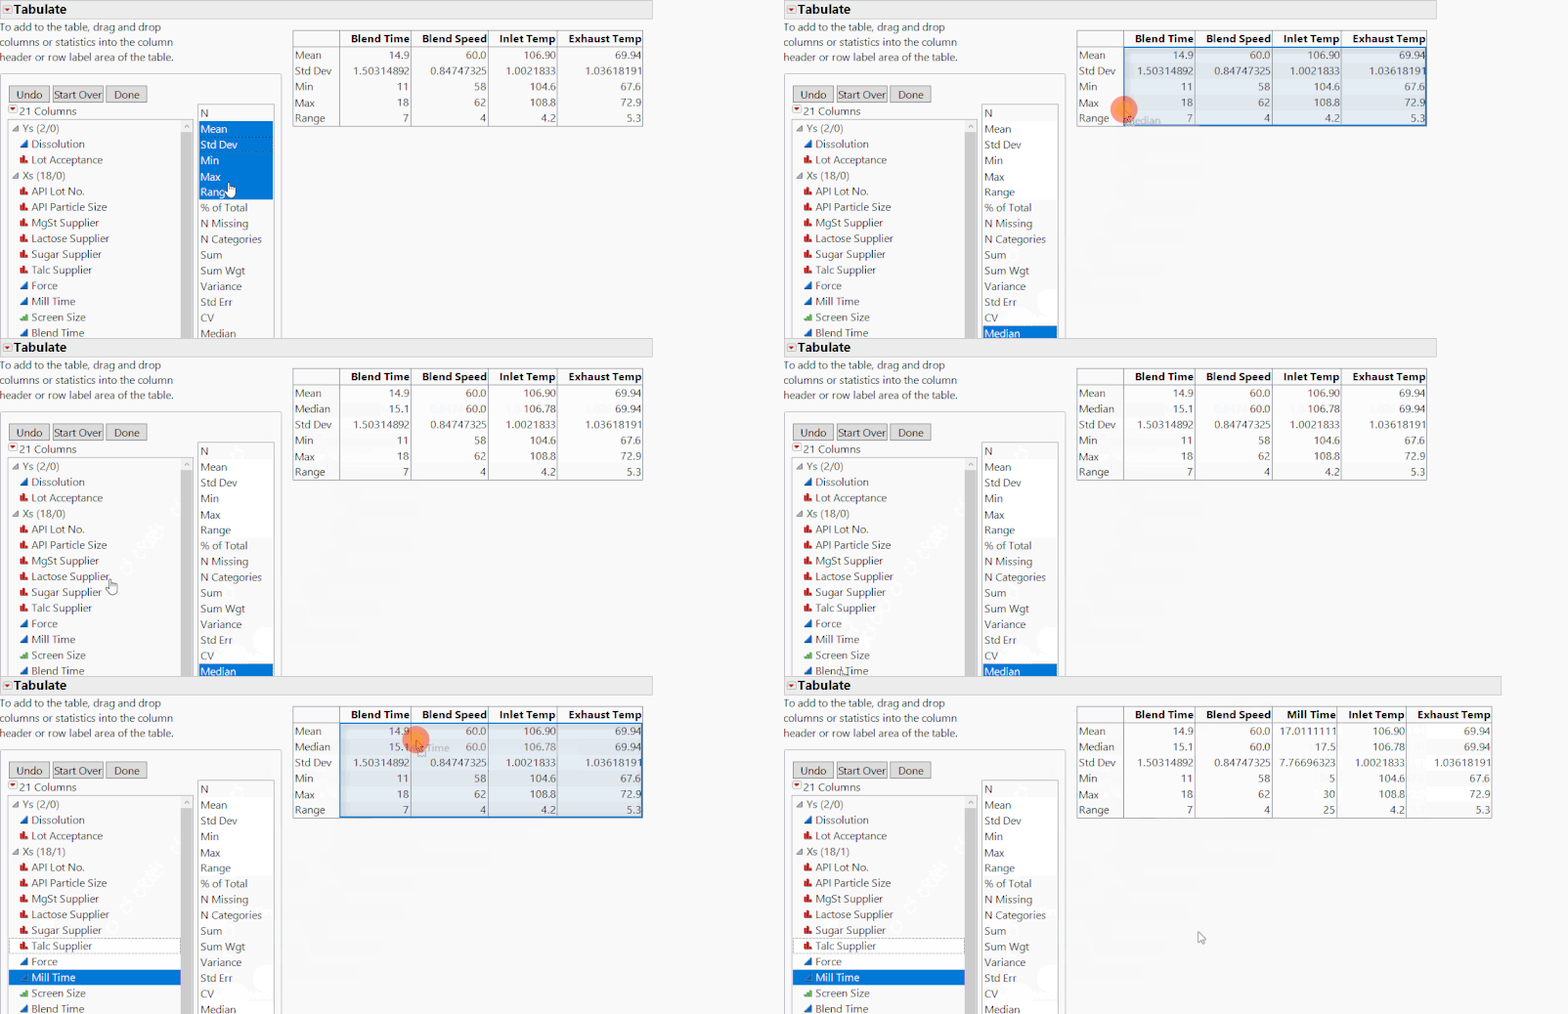
For your second drag-and-drop click, select your desired summary statistics, and then drag and drop them in the gray box next to Sum. In the example below, I am choosing everything from Mean to Range.

In the examples above, I obtained five summary statistics for four variables in matter of seconds! It could have easily been more variables or more statistics in the same amount of time!
FAQ
Below are some of the most frequently asked questions from my demos of the Tabulate platform:
- After creating the table, what if I decide that I want more variables or more statistics? Not a problem! You can just select the statistic or variable and drag it above/below or to the right/left of other statistics/variables. In the example below, I add the median statistic and the Mill Time variable to the previous table.

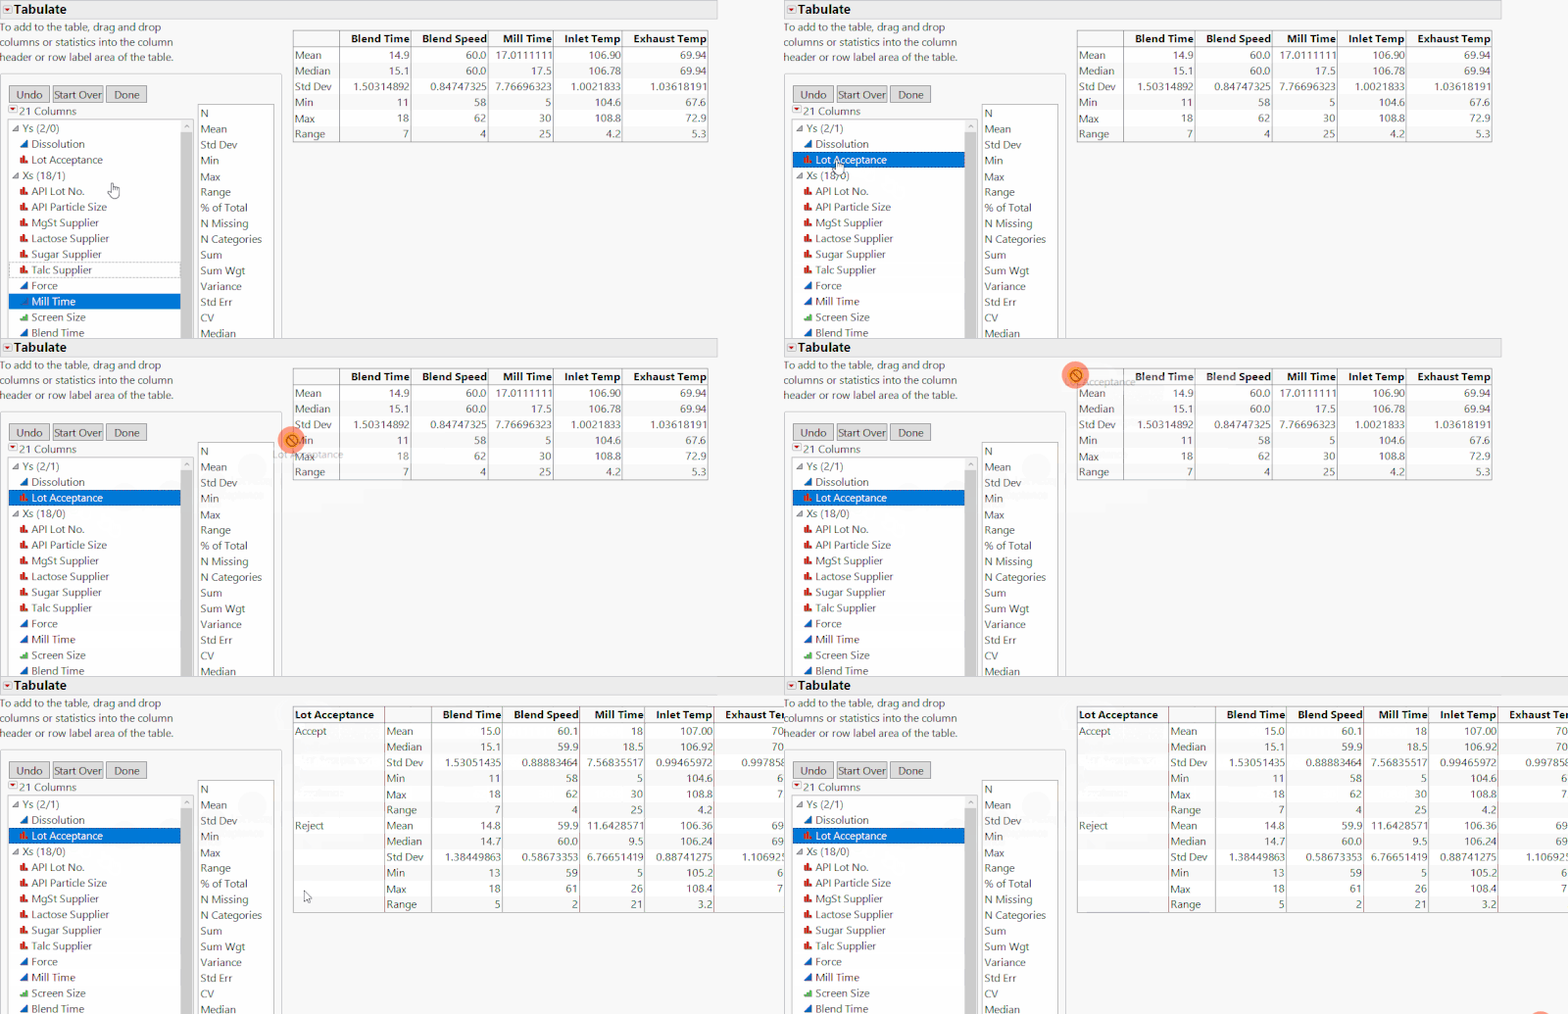
- What if I want to group my summary statistics by categories? Not a problem! You can always drag and drop a categorical variable to group your summary statistics. As shown in the example above, just select a categorical variable and drag it to the left of the column that has the statistics.

- How do I change the formatting of the created table? If you look at the bottom of the window, there is a “Change Format” box. Click on it to see all your different formatting possibilities.

On that note,

is clicking out!
For previous Need For Speed posts, click here!
Tablet Production Need for Speed.jmp
You must be a registered user to add a comment. If you've already registered, sign in. Otherwise, register and sign in.