- JMP User Community
- :
- Blogs
- :
- JMP Blog
- :
- DOE-ing Myself: Week 1 recap
- Subscribe to RSS Feed
- Mark as New
- Mark as Read
- Bookmark
- Subscribe
- Printer Friendly Page
- Report Inappropriate Content
Week one of my effort to unlock running efficiency through design of experiments (DOE) is in the books. I described my experimental setup in my previous blog post.
Recap of Week 1
Stats
Number of runs: 5
Total distance: 37.4 miles (60.2 km)
Total time: 5 hours 6 minutes
Number of catcalls while wearing short shorts: 2
Over the course of week one, weather ranged from hot and clear to cold with driving rain. Waking up even earlier to slam a cup of coffee and spend five minutes on a rowing machine — two things I wouldn’t normally do — took additional planning but is getting easier.
Before we jump into the data, let’s break open the variables I am controlling a bit more. I will break them up into categories and this week discuss gear.
Gear variables
Shorts
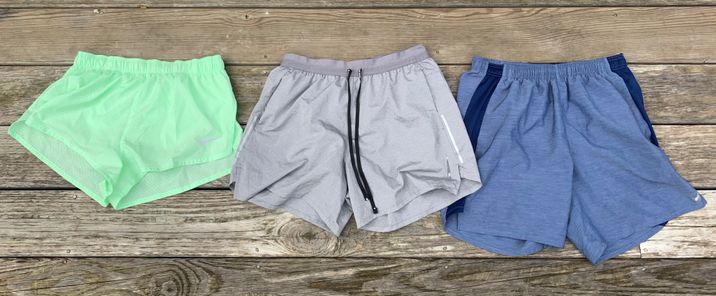
There are two pieces of gear I am controlling for: shoes and shorts. As you’ll recall from the introduction to this DOE project , a fellow JMP Systems Engineer and I have a pet theory that shorter shorts make you run faster (sounds completely legit, right?). I am testing three lengths of running shorts: 7, 5, and 2 inches (18, 13, and 5 cm). I bought the 2-inch shorts specifically for this experiment, and the cheapest ones I could find are mint green. So it goes.

Shoes
I own two pairs of running shoes: a pair for the road and a pair for trails. The trail shoes have less foam cushioning, a more aggressive tread, and a rock plate (rigid plastic sheet to protect my feet from constantly stepping on rocks) while the road shoes have more cushion, no plate, and have after-market force-activated lights (they shine bright when my foot hits the ground, making me visible in the dark), adding a little extra weight. Additionally, the road shoes have more "spring" and so, in theory and, with all else being equal, should improve running efficiency. I am not testing the effect of socks; all my running socks are identical (albeit different colors).
(Fun inconsequential shoe fact: While running the Bandera 50K, a runner caught up and ran with me for about eight minutes. The entire time, he talked about shoes, specifically how much he liked my trail shoes. While this is happening, I’m thinking, "Dude, I can barely breathe! Why are we having this conversation?" Yet here we are, three months removed from the race, and I remember that conversation like it was yesterday and that he was wearing in a collared shirt. So it goes.)
Shoe Specs
Road shoes: Nike Epic React Flyknit, 536 g/pair
Trail shoes: Nike Air Zoom Wildhorse 5, 616 g/pair


Preliminary results
Each week I’ll post preliminary results and save full-blown analysis for the end. It is clear thus far that more data is needed to draw any firm conclusions.
I've embedded my results relating to exercise and gear below from JMP Public. Click on them -- they are interactive!
What do you think the data is communicating?
Feel free to post your theories, predictions of where the data will go, or any questions/suggestions in the comments section!
NOTE: all data is available on JMP Public.
You must be a registered user to add a comment. If you've already registered, sign in. Otherwise, register and sign in.
- © 2024 JMP Statistical Discovery LLC. All Rights Reserved.
- Terms of Use
- Privacy Statement
- About JMP
- JMP Software
- JMP User Community
- Contact
