- JMP User Community
- :
- Blogs
- :
- JMP Blog
- :
- All NFL predictions are wrong, but some can be useful
- Subscribe to RSS Feed
- Mark as New
- Mark as Read
- Bookmark
- Subscribe
- Printer Friendly Page
- Report Inappropriate Content
Before the 2017 NFL season began, I made a prediction on how the season would finish. In that earlier blog post, I used past performance and spending in the off-season to predict how this season would turn out. At this point in the season, most teams have only two games remaining, so let’s check and see how the predictions look at this point.
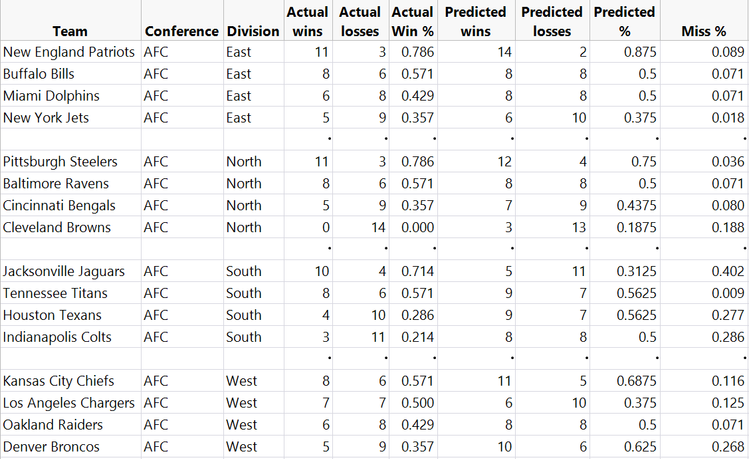
The JMP table for the AFC is shown below.
The table above shows the actual standings as of today with my predictions next to them. The Miss % is the absolute value of the difference between actual and predicted win %. Let's break down the AFC results:
- The Good – The model predicted the order of finish correctly for the AFC East and AFC North. Also, all the teams in both of those divisions have the chance to finish within one game of the predicted record. If standings hold for the remainder of the season, the model will predict three of the four division winners correctly, and four of the six playoff teams.
- The Bad – The AFC South and AFC West are not nearly as accurate as the other divisions. The order of finish is wrong, and most of the teams' records are not close to the predictions.
- The Ugly – Apologies to Jacksonville Jaguars fans! The predictive model was way off on the win total. While the model predicted improvement over the 2016 team, which won only three games, it did not predict this big of an improvement. The Jags have won seven more games than last year with two games left to play. Only four teams in the past seven years have had more than a seven-win improvement year over year.
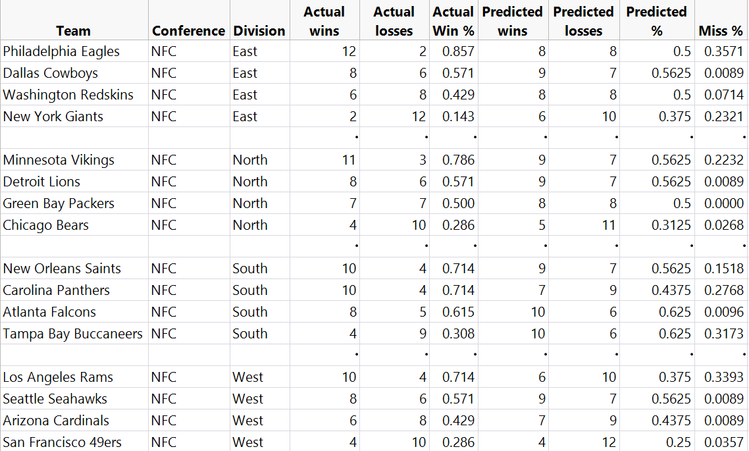
Now let's look at the NFC predictions, shown below.
Looking back at seven years of data, we can see that every year each conference has had at least two repeat playoff participants. But this is a unique year in the NFC as it appears that only one of last year’s playoff participants will be in the playoffs this year. This made a predictive model a little more challenging than a typical year.
- The Good – Overall, the model did a pretty good job of predicting how the NFC would end up. The NFC North has the right order of finish, and every team can finish within two games of the predicted win count. The model did not predict the correct division leader in the NFC East and NFC South, but both division leaders were predicted to be within one game of the division lead. The Packers and the Giants were both playoff teams last year that the model predicted would miss the playoffs. And both of those teams are most likely going to miss the playoffs this year.
- The Bad – The best teams in every division are going to finish with better records than predicted. If the current standings hold up, the model will get only one of the division winners correct, and only three of the six playoff teams correct.
- The Ugly – The Rams, Eagles and Panthers are all much better than the model predicted, with none of those teams projected to make the playoffs by the model. If the playoffs started today, all three would be in, and two would win their divisions. The Buccaneers are much worse than the model predicted and will miss the playoffs, contrary to the model’s prediction.
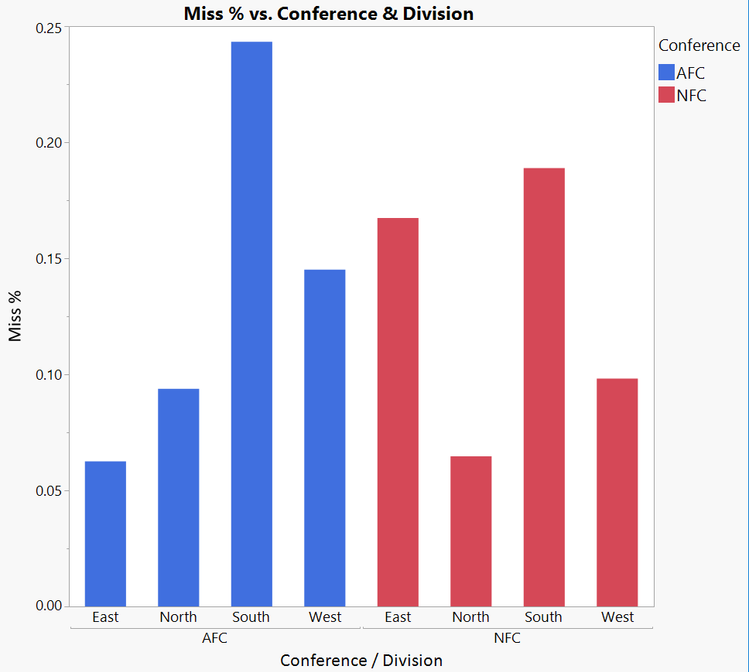
Below is a graph of the mean Miss% of each division.
The model performed best at predicting the NFC North and the AFC East results. The model did a poor job of predicting both AFC and NFC South results. One thing that the projections from the model did an excellent job of predicting is whether a team would improve or get worse. Below are a mosaic plot and contingency table showing whether a team improved or got worse from 2016 to 2017.
The model predicted that 16 teams would improve in 2017 over 2016. Of those 16 teams that the model predicted improvement, 12 teams are winning at a higher rate than they did in 2016. It's only the Broncos, Browns, Bengals and the Buccaneers that the model expected to improve but did not (something about the teams that start with B).
Eight teams were predicted to have no change in their record from 2016. Of those teams, four (the Lions, Titans, Ravens and Cardinals) still have a chance to finish with the same record as last year. The other four teams (Patriots, Redskins, Texans and Colts) are ensured to have a worse record this year than in 2016.
Of the eight teams predicted to worsen year over year, all have been worse this year. None of those eight teams can finish with a better record than last year, and only the Falcons have a chance to finish with the same record.
So, all in all, the model did a nice job of predicting whether a team would improve or worsen year over year. That is, hopefully, the useful part of the model. The magnitude of improvement or worsening was not as accurate. But nevertheless, I had fun building the model and seeing how it did. Enjoy the rest of the season and the playoffs!
- © 2024 JMP Statistical Discovery LLC. All Rights Reserved.
- Terms of Use
- Privacy Statement
- About JMP
- JMP Software
- JMP User Community
- Contact


You must be a registered user to add a comment. If you've already registered, sign in. Otherwise, register and sign in.