- Subscribe to RSS Feed
- Mark Topic as New
- Mark Topic as Read
- Float this Topic for Current User
- Bookmark
- Subscribe
- Mute
- Printer Friendly Page
Discussions
Solve problems, and share tips and tricks with other JMP users.- JMP User Community
- :
- Discussions
- :
- Re: overlapping points with Overlay
- Mark as New
- Bookmark
- Subscribe
- Mute
- Subscribe to RSS Feed
- Get Direct Link
- Report Inappropriate Content
overlapping points with Overlay
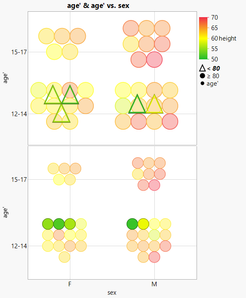
I want to use Overlay to get different markers and legend entries for a subset of my data points.
Unfortunately, as soon as I activate Overlay, the points with the special markers overlap with the other points (top graph):
What is the best way to get:
- the markers
- the legend entries
- non-overlapping, nicely positioned data points
Names Default to Here(1);
dt = Open( "$SAMPLE_DATA/Big Class.jmp" );
Graph Builder(
	Transform Column(
		"Custom Binning...[weight]",
		Numeric,
		Nominal,
		Value Labels( {"." = "Missing", 79 = "< 80", 80 = "≥ 80"} ),
		Use Value Labels( 1 ),
		Formula( If( :weight < 80, 79, :weight >= 80, 80, . ) )
	),
	Transform Column(
		"age'",
		Ordinal,
		Set Property( "Configure Levels", 1 ),
		Set Property( "Value Order", {Custom Order( {12, 15} )} ),
		Value Labels( {12 = "12-14", 15 = "15-17"} ),
		Use Value Labels( 1 ),
		Formula(
			Map Value( :age, {13, 12, 14, 12, 16, 15, 17, 15}, Unmatched( :age ) )
		)
	),
	Size( 469, 709 ),
	Show Control Panel( 0 ),
	Summary Statistic( "Median" ),
	Graph Spacing( 4 ),
	Variables(
		X( :sex ),
		Y( :age' ),
		Y( :age' ),
		Overlay( :"Custom Binning...[weight]"n ),
		Color( :height )
	),
	Elements(
		Position( 1, 1 ),
		Points( X, Y, Legend( 16 ), Jitter( "Centered Grid" ) )
	),
	Elements(
		Position( 1, 2 ),
		Points( X, Y, Overlay( 0 ), Legend( 17 ), Jitter( "Centered Grid" ) )
	),
	SendToReport(
		Dispatch( {}, "age'", ScaleBox,
			{Min( -0.5 ), Max( 1.65217391304348 ), Inc( 1 ), Minor Ticks( 0 )}
		),
		Dispatch( {}, "400", ScaleBox,
			{Legend Model(
				16,
				Properties( 1, {Marker Size( 20 )}, Item ID( "< 80", 1 ) ),
				Properties(
					2,
					{Marker( "FilledCircle" ), Marker Size( 20 )},
					Item ID( "≥ 80", 1 )
				),
				Properties( -1, {Marker( "FilledCircle" )}, Item ID( "M", 1 ) ),
				Properties( -1, {Marker Size( 20 )}, Item ID( "age'", 1 ) )
			), Legend Model(
				17,
				Properties( 1, {Marker Size( 20 )}, Item ID( "age'", 1 ) )
			)}
		),
		Dispatch( {}, "Graph Builder", FrameBox,
			{Marker Drawing Mode( "Outlined" )}
		),
		Dispatch( {}, "Graph Builder", FrameBox( 2 ),
			{Marker Drawing Mode( "Outlined" )}
		)
	)
) - Mark as New
- Bookmark
- Subscribe
- Mute
- Subscribe to RSS Feed
- Get Direct Link
- Report Inappropriate Content
Re: overlapping points with Overlay
Have you tried working on the "jitter"? There are plenty of options on how to lay out the points.
Default is to "auto" but you can choose a different option. It looks like you are using "Centered Grid" - try "Auto" or "Random Uniform".
You can also move the Jitter Limit bar; the farther to the right, the more space there is in between your points.
- Mark as New
- Bookmark
- Subscribe
- Mute
- Subscribe to RSS Feed
- Get Direct Link
- Report Inappropriate Content
Re: overlapping points with Overlay
the goal: something like this one, but with green triangles at position 1-N
Recommended Articles
- © 2026 JMP Statistical Discovery LLC. All Rights Reserved.
- Terms of Use
- Privacy Statement
- Contact Us


