- Don’t miss your chance to experience Discovery Summit Europe at our best available rate! Early bird registration through 31 Oct.
- Graph Builder Toolbar streamlines interactive graphing. Creates shortcuts on Report and GraphBuilder Helpers toolbars. Download and install the extension.
- Subscribe to RSS Feed
- Mark Topic as New
- Mark Topic as Read
- Float this Topic for Current User
- Bookmark
- Subscribe
- Mute
- Printer Friendly Page
Discussions
Solve problems, and share tips and tricks with other JMP users.- User Community
- :
- Discussions
- :
- Re: nonlinear models and data visualisation

- Mark as New
- Bookmark
- Subscribe
- Mute
- Subscribe to RSS Feed
- Get Direct Link
- Report Inappropriate Content
nonlinear models and data visualisation
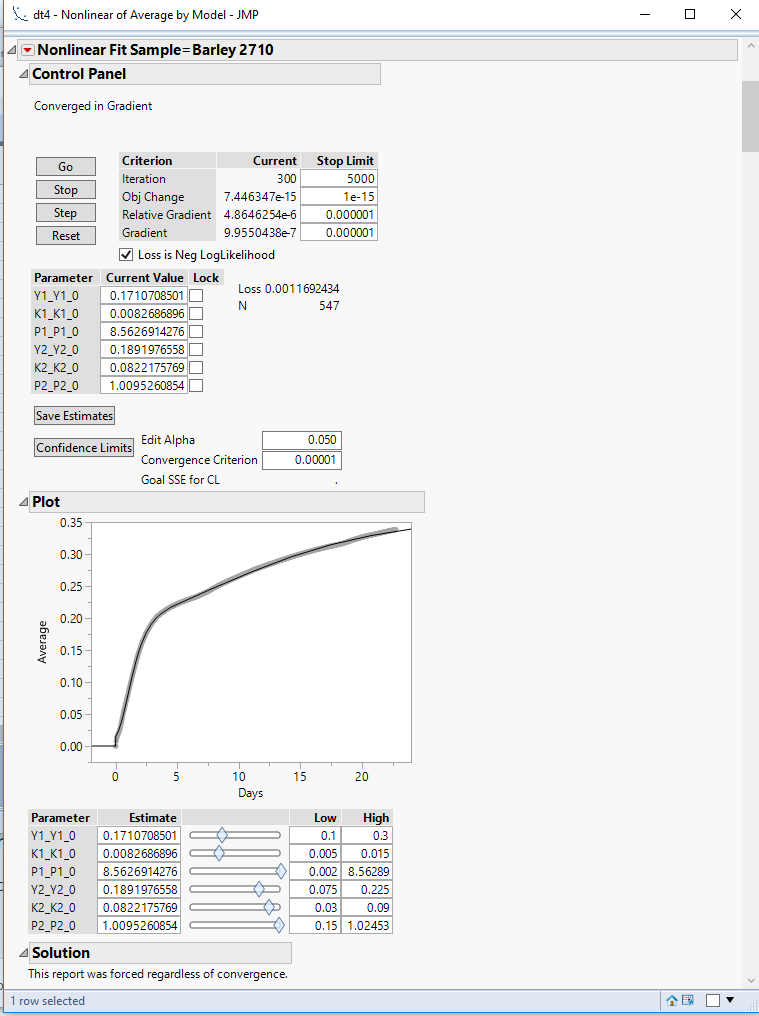
I am trying to create a script that captures the results from nonlinear model fitting and outputs these into a graph. The data set was captured through time continuously to which I fitted a nonlinear model (see picture attached). I have 12 different samples for which I have the same graph if you owuld to scroll down.
However, I would like to report the graph in a way that I can see the data captured for only the rows correspondent to the days 0, 1, 2, 3, 4, 5, and so on until 21 days whithout interfering the curve of the model by sample. In this case I wan to have the experimental data as a scatter plot data and the model as a continuous curve data or smooth curve
How do I do this?
The graph builder does not seem to plot both experimental data and model at the same as first challenge.
My reasoning was that I could potentially use some sort of data filter that I could apply whenever I call the script without interfering with the model column. Do I need to create a new data table specific for the models with the new parameter estimates for each of the 12 samples and then call graph builder?
I also tried using the Graph/Legacy/overlay plot on JMP menu tab. This seems to plot both Data and Model curves, but in this case I realized that JMP did not applied the parameter estimates individually to each sample on the model column after I accepted and saved the paramters estimates for each sample. In this case the Model formula only uses the parameters that were estimated for the sample that appears first on the data table and uses these for the following samples.
Do I need to then creat a new data table that generates 12 columns with the model formula using the determined parameter estimates for each sample to be able to plot both model and experimental data together for each sample?
I hope this is clear. I can upload a screen shot of the data table etc
Accepted Solutions

- Mark as New
- Bookmark
- Subscribe
- Mute
- Subscribe to RSS Feed
- Get Direct Link
- Report Inappropriate Content
Re: nonlinear models and data visualisation
One potential solution:
- Save the model to a formula column. This should evaluate to give you a copy of the model value at any day in your run.
- Open graph builder.
- Drop both the Experimental Results and the Model Prediction on the Y axis, Days on the X axis
- Using the control panel, drop in both Data Points and Connected Line.
- Using the "Variables" drop down, configure the Data Points to only work off Experimental Results and the Connected Line to only work off the Model Prediction.
Hope that helps!
- Mark as New
- Bookmark
- Subscribe
- Mute
- Subscribe to RSS Feed
- Get Direct Link
- Report Inappropriate Content
Re: nonlinear models and data visualisation
One potential solution:
- Save the model to a formula column. This should evaluate to give you a copy of the model value at any day in your run.
- Open graph builder.
- Drop both the Experimental Results and the Model Prediction on the Y axis, Days on the X axis
- Using the control panel, drop in both Data Points and Connected Line.
- Using the "Variables" drop down, configure the Data Points to only work off Experimental Results and the Connected Line to only work off the Model Prediction.
Hope that helps!
- Mark as New
- Bookmark
- Subscribe
- Mute
- Subscribe to RSS Feed
- Get Direct Link
- Report Inappropriate Content
Re: nonlinear models and data visualisation
Thanks


- Mark as New
- Bookmark
- Subscribe
- Mute
- Subscribe to RSS Feed
- Get Direct Link
- Report Inappropriate Content
Re: nonlinear models and data visualisation
No, instead of using a wide format (responses saved in a dozen data columns), use the tall format (responses saved in one column and use a second column to identify the sample). Now use the sample ID in the By role of most platforms or the Group role in the Nonlinear or Plot Curve platform.
- Mark as New
- Bookmark
- Subscribe
- Mute
- Subscribe to RSS Feed
- Get Direct Link
- Report Inappropriate Content
Re: nonlinear models and data visualisation
- Mark as New
- Bookmark
- Subscribe
- Mute
- Subscribe to RSS Feed
- Get Direct Link
- Report Inappropriate Content
Re: nonlinear models and data visualisation
I am teaching now so I am not free to check but Nonlinear might save the formula with the different sets of parameters for you. The Match() function is useful here. You match on group and replicate the model for each result but apply the unique parameter estimates for each group. It becomes a branching of sorts. Like a CASE statement in some languages.
- Mark as New
- Bookmark
- Subscribe
- Mute
- Subscribe to RSS Feed
- Get Direct Link
- Report Inappropriate Content
Re: nonlinear models and data visualisation
I am trying to write a script that would open a new column for the new parameter estimates.
After running the Nonlinear fit I get the estimates and errors. I then keep only the data tables of interest and try to somehow get the values of interest to be used in a new column with the same model formula. The idea would be to specify the model parameters based on the estimates.
I need some help as I do not know if this is the right way of doing it or if I need to use other functions. The script below may be a bit complicated to follow but that is probably because I have almost non experience in programming. The script obviously works up
@Mark_Bailey wrote:I am teaching now so I am not free to check but Nonlinear might save the formula with the different sets of parameters for you. The Match() function is useful here. You match on group and replicate the model for each result but apply the unique parameter estimates for each group. It becomes a branching of sorts. Like a CASE statement in some languages.
until the part in BOLD:
col9 = New Column("Model");
col9<< set formula (Parameter({Y1_Y1_0 = 0.2, K1_K1_0 = 0.01, P1_P1_0 = 0.004, Y2_Y2_0 = 0.15, K2_K2_0 = 0.06, P2_P2_0 = 0.3}, If(:Days>0, (Y1_Y1_0 * Exp(-Exp(((K1_K1_0 * Exp()) / Y1_Y1_0) * (P1_P1_0 - :Days))) + Y2_Y2_0 * Exp(-Exp(((K2_K2_0 * Exp()) / Y2_Y2_0) * (P2_P2_0 - :Days)))),0)));
col10=newcolumn("Err");
col10<< set Formula((:Average - :Model) ^ 2);
col10<<Evalformula;
col10<<Get formula;
obj = Nonlinear(Y( :Average ), X( :Model ), Loss( :Err ), Iteration Limit( 5000 ), By( :Sample ));
obj << go;
//returns a list of vectors where each vector, contains the parameters estimates
obj << get estimates;
//also see Get SSE, Get Parameter Names, Get CI
//Alternately, make a table
_xx = obj << Xpath("//OutlineBox[@helpKey='Nonlinear Solution']");
//only 2 groups so only 2 are found; each contains two sub tables
fit_dt = (_xx[1]<<Find(TableBox(1))) << Make Combined Data Table;
est_dt = (_xx[1]<<Find(TableBox(2))) << Make Combined Data Table;
fit_dt << set Name("NonLin Fit Errors");
est_dt << set Name("NonLin Fit Estimates");
Names Default To Here( 1 );
DontClose = {"dt4", "NonLin Fit Errors", "NonLin Fit Estimates"}; // Example names of tables you want to leave
// Loop backwards through the list, so the table numbers do not change
For( i = N Table(), i >= 0, i--,
If( Contains( DontClose, Data Table( i ) << get name ),
Continue(),
Close( Data Table( i ), "No Save" )
)
);
dt = Data Table("NonLin Fit Estimates");
dt2<<column("Estimates")<<values({Y1_Y1_0, K1_K1_0, P1_P1_0, Y2_Y2_0, K2_K2_0, P2_P2_0}, By(:Sample));
myList=:Estimates<<get values
dt0 = Data Table ("dt4");
dt0<< New Column("Fitted Model By Sample");
col11="Fitted Model By Sample";
col11 << set formula (Parameter({Y1_Y1_0, K1_K1_0, P1_P1_0, Y2_Y2_0, K2_K2_0, P2_P2_0}, If(:Days>0, (Y1_Y1_0 * Exp(-Exp(((K1_K1_0 * Exp()) / Y1_Y1_0) * (P1_P1_0 - :Days))) + Y2_Y2_0 * Exp(-Exp(((K2_K2_0 * Exp()) / Y2_Y2_0) * (P2_P2_0 - :Days)))),0), Set Property("Predicting", {:Average, Creator("Nonlinear")}), By (:Sample)));
For each Row(col11= set formula (Match("Parameter", "Estimates")));
col11<<Evalformula;
col11<<Get formula;
Any suggestions?
Recommended Articles
- © 2026 JMP Statistical Discovery LLC. All Rights Reserved.
- Terms of Use
- Privacy Statement
- Contact Us