- JMP will suspend normal business operations for our Winter Holiday beginning on Wednesday, Dec. 24, 2025, at 5:00 p.m. ET (2:00 p.m. ET for JMP Accounts Receivable).
Regular business hours will resume at 9:00 a.m. EST on Friday, Jan. 2, 2026. - We’re retiring the File Exchange at the end of this year. The JMP Marketplace is now your destination for add-ins and extensions.
- Subscribe to RSS Feed
- Mark Topic as New
- Mark Topic as Read
- Float this Topic for Current User
- Bookmark
- Subscribe
- Mute
- Printer Friendly Page
Discussions
Solve problems, and share tips and tricks with other JMP users.- JMP User Community
- :
- Discussions
- :
- merge table from 2 csv files
- Mark as New
- Bookmark
- Subscribe
- Mute
- Subscribe to RSS Feed
- Get Direct Link
- Report Inappropriate Content
merge table from 2 csv files
Hi,
I have two csv files (round1.csv & round2.csv). How can I merge into a new table mergeRound.csv. I was trying to play around with the
Last Name,First Name,Number combine should be the same. The rest of the columns should be merge.
I was playing around the Tables menu but cannot figure it out before putting it to JSL.
Thanks.
- Mark as New
- Bookmark
- Subscribe
- Mute
- Subscribe to RSS Feed
- Get Direct Link
- Report Inappropriate Content
Re: merge table from 2 csv files
I would set up your data in an analytical form. Basically, the data are concatenated. See illustration below:
- Mark as New
- Bookmark
- Subscribe
- Mute
- Subscribe to RSS Feed
- Get Direct Link
- Report Inappropriate Content
Re: merge table from 2 csv files
Jim,
Last Name, First Name, and Number will be my unique key.
I was going to compare each individual assist, block, score, dunk, etc... via plot Last Name, First Name, and Number. by between round 1 & round 2. That's why I put it in the same row.
Not sure if that is the right thing to do.
- Mark as New
- Bookmark
- Subscribe
- Mute
- Subscribe to RSS Feed
- Get Direct Link
- Report Inappropriate Content
Re: merge table from 2 csv files
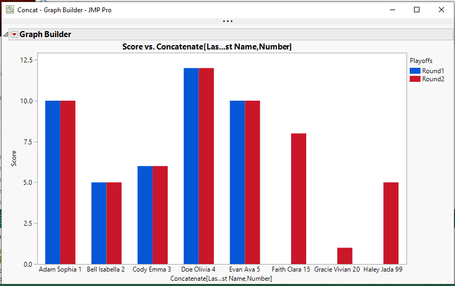
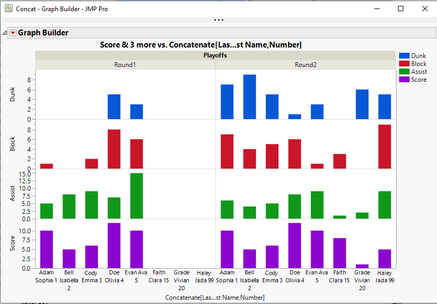
The format that I suggest is supported within Graph Builder to produce your suggested graph(s)
Below is a script that produces these graphs from the Concatenated form of the data. Additionally, if your merged form of the data the
Tables==>Split
can easily be used to split the data to a row based format
Names Default to Here(1);

dt = New Table( "Concat",
	Add Rows( 13 ),
	New Column( "Playoffs",
		Character( 8 ),
		"Nominal",
		Set Values(
			{"Round1", "Round1", "Round1", "Round1", "Round1", "Round2", "Round2",
			"Round2", "Round2", "Round2", "Round2", "Round2", "Round2"}
		)
	),
	New Column( "Last Name",
		Character( 8 ),
		"Nominal",
		Set Values(
			{"Adam", "Bell", "Cody", "Doe", "Evan", "Adam", "Bell", "Cody", "Doe",
			"Evan", "Faith", "Gracie", "Haley"}
		)
	),
	New Column( "First Name",
		Character( 8 ),
		"Nominal",
		Set Values(
			{"Sophia", "Isabella", "Emma", "Olivia", "Ava", "Sophia", "Isabella",
			"Emma", "Olivia", "Ava", "Clara", "Vivian", "Jada"}
		)
	),
	New Column( "Number",
		Numeric,
		"Continuous",
		Format( "Best", 12 ),
		Set Values( [1, 2, 3, 4, 5, 1, 2, 3, 4, 5, 15, 20, 99] )
	),
	New Column( "Assist",
		Numeric,
		"Continuous",
		Format( "Best", 12 ),
		Set Values( [5, 8, 9, 7, 15, 6, 4, 5, 8, 9, 1, 2, 9] )
	),
	New Column( "Block",
		Numeric,
		"Continuous",
		Format( "Best", 12 ),
		Set Values( [1, 0, 2, 8, 6, 7, 4, 5, 6, 1, 3, ., 9] )
	),
	New Column( "Dunk",
		Numeric,
		"Continuous",
		Format( "Best", 12 ),
		Set Values( [0, 0, 0, 5, 3, 7, 9, 5, 1, 3, ., 6, 5] )
	),
	New Column( "Score",
		Numeric,
		"Continuous",
		Format( "Best", 12 ),
		Set Values( [10, 5, 6, 12, 10, 10, 5, 6, 12, 10, 8, 1, 5] )
	)
);

Graph Builder(
	Size( 739, 450 ),
	Show Control Panel( 0 ),
	Variables(
		X(
			Transform Column(
				"Concatenate[Las...st Name,Number]",
				Character,
				Formula(
					:Last Name || " " || :First Name || " " || Char( :Number )
				)
			)
		),
		Y( :Score ),
		Overlay( :Playoffs )
	),
	Elements( Bar( X, Y, Legend( 11 ) ) )
);

Graph Builder(
	Size( 739, 500 ),
	Show Control Panel( 0 ),
	Variables(
		X(
			Transform Column(
				"Concatenate[Las...st Name,Number]",
				Character,
				Formula(
					:Last Name || " " || :First Name || " " || Char( :Number )
				)
			)
		),
		Y( :Dunk ),
		Y( :Block ),
		Y( :Assist ),
		Y( :Score ),
		Group X( :Playoffs )
	),
	Elements( Position( 1, 1 ), Bar( X, Y, Legend( 15 ) ) ),
	Elements( Position( 1, 2 ), Bar( X, Y, Legend( 14 ) ) ),
	Elements( Position( 1, 3 ), Bar( X, Y, Legend( 12 ) ) ),
	Elements( Position( 1, 4 ), Bar( X, Y, Legend( 11 ) ) )
);
Recommended Articles
- © 2025 JMP Statistical Discovery LLC. All Rights Reserved.
- Terms of Use
- Privacy Statement
- Contact Us


