- Subscribe to RSS Feed
- Mark Topic as New
- Mark Topic as Read
- Float this Topic for Current User
- Bookmark
- Subscribe
- Mute
- Printer Friendly Page
Discussions
Solve problems, and share tips and tricks with other JMP users.- JMP User Community
- :
- Discussions
- :
- how to use JMP to calculate Lot to Lot, Wafer to Wafer, Within wafer variation?
- Mark as New
- Bookmark
- Subscribe
- Mute
- Subscribe to RSS Feed
- Get Direct Link
- Report Inappropriate Content
how to use JMP to calculate Lot to Lot, Wafer to Wafer, Within wafer variation?
My question is how to use JMP to calculate Lot to Lot, Wafer to Wafer, Within wafer variation and quantify the uniformity?
for example, I have one table, in this table have column "lot", column "wafer", column "site", also includes one data column.
within same lot have 15 wafers, within same wafer have 20 sites, so the question is how to use JMP to calculate and quantify the percentage of Lot to Lot, Wafer to Wafer, Within wafer or how to show which is the major contributor, do have formula?
thanks
- Mark as New
- Bookmark
- Subscribe
- Mute
- Subscribe to RSS Feed
- Get Direct Link
- Report Inappropriate Content
Re: how to use JMP to calculate Lot to Lot, Wafer to Wafer, Within wafer variation?
- Mark as New
- Bookmark
- Subscribe
- Mute
- Subscribe to RSS Feed
- Get Direct Link
- Report Inappropriate Content
Re: how to use JMP to calculate Lot to Lot, Wafer to Wafer, Within wafer variation?
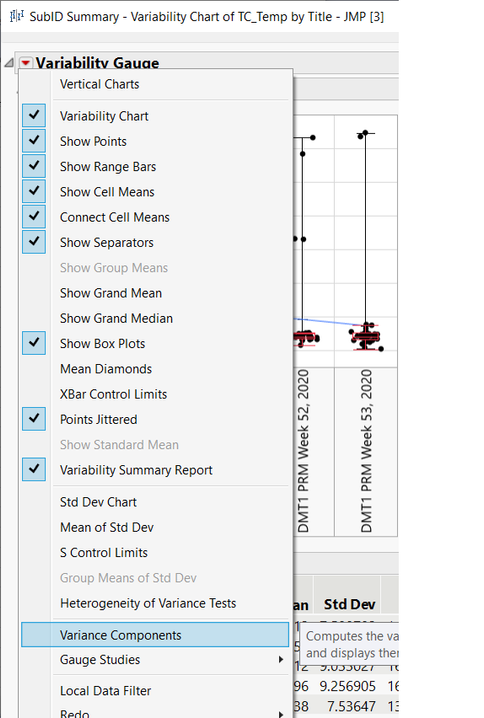
I think you can use Variability plot and then select "Variance Components"
the final report would look like this:
So give it a try!
- Mark as New
- Bookmark
- Subscribe
- Mute
- Subscribe to RSS Feed
- Get Direct Link
- Report Inappropriate Content
Re: how to use JMP to calculate Lot to Lot, Wafer to Wafer, Within wafer variation?
There are 2 approaches to estimate variance components. Assuming your sampling plan is nested (hierarchical) and may look like:
You may use the control chart method to analyze the data. This would start at the within wafer layer with a range chart to determine within wafer consistency (if it is stable and consistent, estimate the variance by Vww = (Rbar/d2)^2) and then compare the within wafer to the other components in the study with an Xbar chart (the control limits are a function of the within wafer variability)...if the Xbar it out-of-control, then "roll up the tree" by summarizing the within wafer data, and creating a new subgroup based on wafer-to-wafer variation, etc. This will allow for both assessing consistency and estimating variance components.
The second way would be (as suggested) creating a Variability Chart (your components must bene set to nominal) and having JMP calculate the variance components for a nested study.
Recommended Articles
- © 2026 JMP Statistical Discovery LLC. All Rights Reserved.
- Terms of Use
- Privacy Statement
- Contact Us


