- Subscribe to RSS Feed
- Mark Topic as New
- Mark Topic as Read
- Float this Topic for Current User
- Bookmark
- Subscribe
- Mute
- Printer Friendly Page
Discussions
Solve problems, and share tips and tricks with other JMP users.- JMP User Community
- :
- Discussions
- :
- how to assign color by group when making a line graph?
- Mark as New
- Bookmark
- Subscribe
- Mute
- Subscribe to RSS Feed
- Get Direct Link
- Report Inappropriate Content
how to assign color by group when making a line graph?
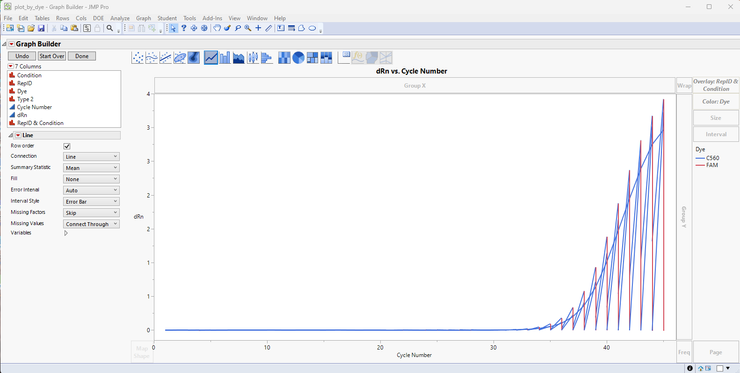
I want to assign the same category (dye) in the same color when making a plot.
see plot below.
I would like to assign all the C560 plotted lines in orange instead of different colors. all the FAM in green.
I want to keep individual line not a line with the mean of the group.
Accepted Solutions
- Mark as New
- Bookmark
- Subscribe
- Mute
- Subscribe to RSS Feed
- Get Direct Link
- Report Inappropriate Content
Re: how to assign color by group when making a line graph?
- Sort the data table by RepID & Condition and Cycle Number
- Run dRn vs. Cycle Number table script
- From the red triangle select Show Control Panel
- Drag the Dye column to the Color drop area
- In the Line properties in the Control Panel, select the Row Order check box
I believe that gives you what you want
- Mark as New
- Bookmark
- Subscribe
- Mute
- Subscribe to RSS Feed
- Get Direct Link
- Report Inappropriate Content
Re: how to assign color by group when making a line graph?
you can use the value color property of the column and define the same color for multiple entries:
... alternatively you can define a new column which can be used for the COLOR - and continue to use your original column as Overlay.
Here is an example with Measles data from the STIPS course. Separation by Region is just applied to clearly see the different color groups.
Open( "$SAMPLE_STIPS/Measles.jmp" );
Graph Builder(
	Size( 1061, 493 ),
	Summary Statistic( "Median" ),
	Graph Spacing( 4 ),
	Variables(
		X( :Year ),
		Y( :Cases ),
		Group X( :Region ),
		Overlay( :State Abbr. ),
		Color( :Region )
	),
	Elements( Line( X, Y, Legend( 5 ) ) )
);
- Mark as New
- Bookmark
- Subscribe
- Mute
- Subscribe to RSS Feed
- Get Direct Link
- Report Inappropriate Content
Re: how to assign color by group when making a line graph?
- Sort the data table by RepID & Condition and Cycle Number
- Run dRn vs. Cycle Number table script
- From the red triangle select Show Control Panel
- Drag the Dye column to the Color drop area
- In the Line properties in the Control Panel, select the Row Order check box
I believe that gives you what you want
- Mark as New
- Bookmark
- Subscribe
- Mute
- Subscribe to RSS Feed
- Get Direct Link
- Report Inappropriate Content
Re: how to assign color by group when making a line graph?
That is very helpful.
One more question is that what does this Row order selection does to the graph.
- Mark as New
- Bookmark
- Subscribe
- Mute
- Subscribe to RSS Feed
- Get Direct Link
- Report Inappropriate Content
Re: how to assign color by group when making a line graph?
- Mark as New
- Bookmark
- Subscribe
- Mute
- Subscribe to RSS Feed
- Get Direct Link
- Report Inappropriate Content
Re: how to assign color by group when making a line graph?
thank you.
Recommended Articles
- © 2026 JMP Statistical Discovery LLC. All Rights Reserved.
- Terms of Use
- Privacy Statement
- Contact Us


