- Subscribe to RSS Feed
- Mark Topic as New
- Mark Topic as Read
- Float this Topic for Current User
- Bookmark
- Subscribe
- Mute
- Printer Friendly Page
Discussions
Solve problems, and share tips and tricks with other JMP users.- JMP User Community
- :
- Discussions
- :
- different 4PL models
- Mark as New
- Bookmark
- Subscribe
- Mute
- Subscribe to RSS Feed
- Get Direct Link
- Report Inappropriate Content
different 4PL models
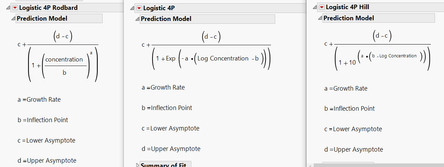
JMP has three different 4P models to fit sigmodal curves, Logistic 4P and Logistic 4P Hill use Log concentration, and Logistic 4P Rodbard uses non-log concentration. Looking into the formulas, the sign of the Growth Rate (slope) from Logistic 4P and Logistic 4P Hill are opposite of those from classical 4PL definition and 4P Rodbard.
Can you help to explain why there is such a difference?
Thanks!
classical definition of 4PL
- Mark as New
- Bookmark
- Subscribe
- Mute
- Subscribe to RSS Feed
- Get Direct Link
- Report Inappropriate Content
Re: different 4PL models
Hi @GroupSquareWolf ,
I'm not 100% sure, but I think the difference is that in JMP the definition is different. Instead of starting at the a 0 response at 0 concentration, I think JMP defines it such that at 0 concentration, the response is non-zero and starts at y=d, then as you go to infinite concentration, then the function decays to a. Because of that, I think the 4PL function needs to change.
Hope this helps!,
DS
- Mark as New
- Bookmark
- Subscribe
- Mute
- Subscribe to RSS Feed
- Get Direct Link
- Report Inappropriate Content
Re: different 4PL models
Actually, all of these forms are classical. They were developed in the 1970s when programmable calculators made iterative numerical solvers accessible. They were not developed by statisticians or numerical analysts, so their estimation properties were not studied. Some of these parameterizations lead to higher correlations among the parameter estimates, which leads to greater numerical instability and a greater chance of non-convergence.
The example of the classical 4PL model is the Rodbard model in JMP.
- Mark as New
- Bookmark
- Subscribe
- Mute
- Subscribe to RSS Feed
- Get Direct Link
- Report Inappropriate Content
Re: different 4PL models
Here's my opinion but not 100% sure.
In a glance, 4pl and 4pl hill have reversed growth factor. But if you take minus out of a (growth factor) and put it into parenthesis in 4p formula, it would be exactly the same concept with 4p hill formula. I think you can select one of them according to your concentration range and how steep your growth factor is. The reason I guess why they put reversed formula is for different type of curves, association and dissociation. The graph you showed is about increasing response reaction. But there's a case of inhibition, which draws decreasing response. But the thing is they are all the same. Hope it helps.
Recommended Articles
- © 2026 JMP Statistical Discovery LLC. All Rights Reserved.
- Terms of Use
- Privacy Statement
- Contact Us


