- Subscribe to RSS Feed
- Mark Topic as New
- Mark Topic as Read
- Float this Topic for Current User
- Bookmark
- Subscribe
- Mute
- Printer Friendly Page
Discussions
Solve problems, and share tips and tricks with other JMP users.- JMP User Community
- :
- Discussions
- :
- canonical analysis plot interperation
- Mark as New
- Bookmark
- Subscribe
- Mute
- Subscribe to RSS Feed
- Get Direct Link
- Report Inappropriate Content
canonical analysis plot interperation
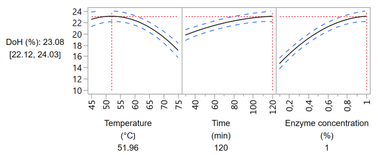
Hi, I have a question about the canonical analysis. What do the black, red and blue lines exactly mean in the figure?
Thank you very much!
- Mark as New
- Bookmark
- Subscribe
- Mute
- Subscribe to RSS Feed
- Get Direct Link
- Report Inappropriate Content
Re: canonical analysis plot interperation
This picture looks like the Prediction Profiler. The vertical dotted lines represent the current value of each independent variable. The horizontal dotted lines represent the dependent variable predicted by the model. The solid line is a 'profile' that shows how the dependent variable is related to the independent variable, holding the other independent variables fixed. The dashed lines that surround the solid line are point-wise confidence intervals on predicted value.
The the help for the Prediction Profiler.
- Mark as New
- Bookmark
- Subscribe
- Mute
- Subscribe to RSS Feed
- Get Direct Link
- Report Inappropriate Content
Re: canonical analysis plot interperation
Hello! I feel a bit confused. The discriminant analysis with its canonical plot can be considered as a CVA (Canonical Variate Analysis) or it is a different technique? For example, I have spectral data analyzed by PCA and I ran also via discrminant analysis. Not sure, if it was correct. Thanks for the consultation!
Recommended Articles
- © 2026 JMP Statistical Discovery LLC. All Rights Reserved.
- Terms of Use
- Privacy Statement
- Contact Us


