- Subscribe to RSS Feed
- Mark Topic as New
- Mark Topic as Read
- Float this Topic for Current User
- Bookmark
- Subscribe
- Mute
- Printer Friendly Page
Discussions
Solve problems, and share tips and tricks with other JMP users.- JMP User Community
- :
- Discussions
- :
- X-axis of control chart builder
- Mark as New
- Bookmark
- Subscribe
- Mute
- Subscribe to RSS Feed
- Get Direct Link
- Report Inappropriate Content
X-axis of control chart builder
I want to create a control chart of a concentration versus time. This works well when I don't fill in the X-axis however when moving a time variable in h:min:sec to the X area the chart changes dramatically, why is this? How to solve? Thanks
Accepted Solutions
- Mark as New
- Bookmark
- Subscribe
- Mute
- Subscribe to RSS Feed
- Get Direct Link
- Report Inappropriate Content
Re: X-axis of control chart builder
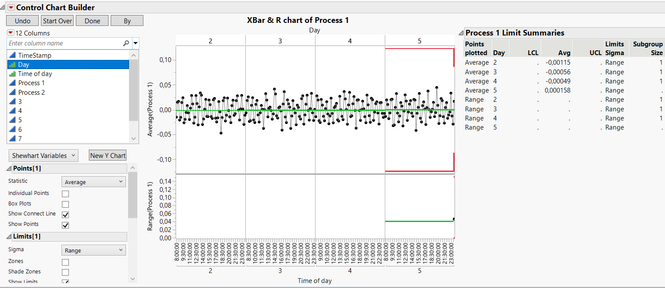
The problem is that the subgroup values are not unique. JMP finds at least one subgroup that has more than 1 observation. JMP therefore switches to an XBar chart. Control Chart Builder has no way to switch from an XBar chart to an XMR chart. The legacy control charts have this functionality. You should switch to Analyze->Quality and Process->Legacy Control Charts->IR.
- Mark as New
- Bookmark
- Subscribe
- Mute
- Subscribe to RSS Feed
- Get Direct Link
- Report Inappropriate Content
Re: X-axis of control chart builder
It sees that the time is based upon seconds, and it will change the increment. Try changing the date time variable to nominal or ordinal, and see if that solves your issue.
- Mark as New
- Bookmark
- Subscribe
- Mute
- Subscribe to RSS Feed
- Get Direct Link
- Report Inappropriate Content
Re: X-axis of control chart builder
I tried to change to ordinal, nominal.. does not work.
Below a fragment of my data set, I would like the Time of day on X-axis.
For "Time of Day" column info is as follows: switching to continous or nominal does not work
Below is the result I get, what is wrong?
- Mark as New
- Bookmark
- Subscribe
- Mute
- Subscribe to RSS Feed
- Get Direct Link
- Report Inappropriate Content
Re: X-axis of control chart builder
This is the required IMR chart with day as phase but with X-axis "Time of day" instead of subgroup
- Mark as New
- Bookmark
- Subscribe
- Mute
- Subscribe to RSS Feed
- Get Direct Link
- Report Inappropriate Content
Re: X-axis of control chart builder
The problem is that the subgroup values are not unique. JMP finds at least one subgroup that has more than 1 observation. JMP therefore switches to an XBar chart. Control Chart Builder has no way to switch from an XBar chart to an XMR chart. The legacy control charts have this functionality. You should switch to Analyze->Quality and Process->Legacy Control Charts->IR.
- Mark as New
- Bookmark
- Subscribe
- Mute
- Subscribe to RSS Feed
- Get Direct Link
- Report Inappropriate Content
Re: X-axis of control chart builder
Hello Tonya, for each of the five days there is an unique process mesurement at each Time of day going from 8:00 in the morning to midnight, so when using day as phase I woud expect an ImR chart?
- Mark as New
- Bookmark
- Subscribe
- Mute
- Subscribe to RSS Feed
- Get Direct Link
- Report Inappropriate Content
Re: X-axis of control chart builder
Small correction above, there are 4 days (day = ordinal) labeled 2 to 5.
- Mark as New
- Bookmark
- Subscribe
- Mute
- Subscribe to RSS Feed
- Get Direct Link
- Report Inappropriate Content
Re: X-axis of control chart builder
Problem is solved, there was one time of day too much for 5th day and so yes no unique figure for that moment, x-axis setup is of critical imortance, thanks everyone!
Recommended Articles
- © 2026 JMP Statistical Discovery LLC. All Rights Reserved.
- Terms of Use
- Privacy Statement
- Contact Us


