- Subscribe to RSS Feed
- Mark Topic as New
- Mark Topic as Read
- Float this Topic for Current User
- Bookmark
- Subscribe
- Mute
- Printer Friendly Page
Discussions
Solve problems, and share tips and tricks with other JMP users.- JMP User Community
- :
- Discussions
- :
- Re: Slopes
- Mark as New
- Bookmark
- Subscribe
- Mute
- Subscribe to RSS Feed
- Get Direct Link
- Report Inappropriate Content
Slopes
Hello everyone,
I have a graph of this sort (attached Image) and I want to find M (slope) of the drop from the peak. How can I possibly find the slopes of these two on JMP?
Pls help, Thank you
Accepted Solutions
- Mark as New
- Bookmark
- Subscribe
- Mute
- Subscribe to RSS Feed
- Get Direct Link
- Report Inappropriate Content
Re: Slopes
The easiest way to do this, is to use the Fit Y by X platform, and have it draw your curve and then to select
- Fit Each Value
- Fit Line
- Select Local Data Filter and select the X value to be filtered
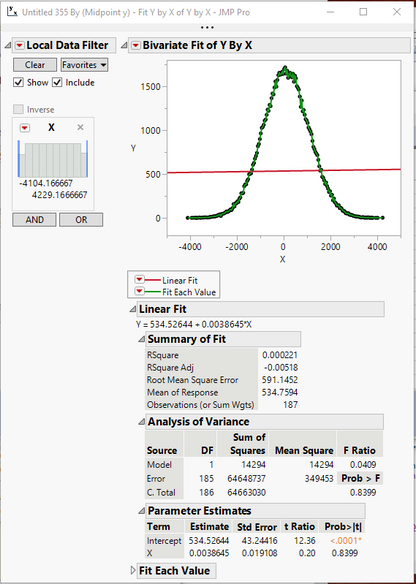
Here are the results with my example data
Note that under the Parameter Estimates you can see the slope of .0038645
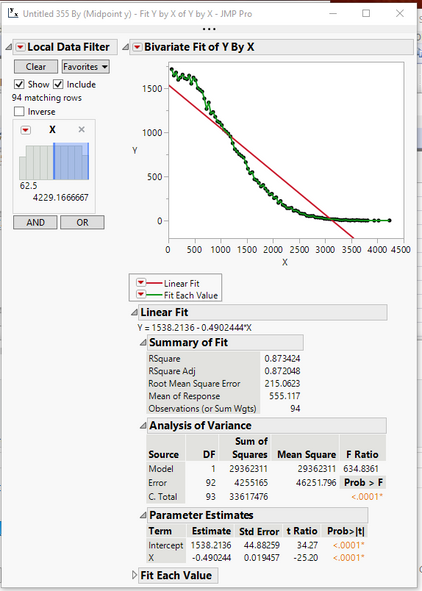
Now all you have to do, is to use the Data Filter to select only the values on the left side of the graph.
The regression now is only calculated on the down slope, which is -0.490244
- Mark as New
- Bookmark
- Subscribe
- Mute
- Subscribe to RSS Feed
- Get Direct Link
- Report Inappropriate Content
Re: Slopes
You should be able to accomplish this, by excluding the data points on the left side of the curve, and then regressing the values from the peak value to the lowest value on the right.
For the poly curve line, you could use this technique multiple times.
- Mark as New
- Bookmark
- Subscribe
- Mute
- Subscribe to RSS Feed
- Get Direct Link
- Report Inappropriate Content
Re: Slopes
So sorry, Please this is not so clear to me. How do I regress the value from the peak to the lowest?
- Mark as New
- Bookmark
- Subscribe
- Mute
- Subscribe to RSS Feed
- Get Direct Link
- Report Inappropriate Content
Re: Slopes
The easiest way to do this, is to use the Fit Y by X platform, and have it draw your curve and then to select
- Fit Each Value
- Fit Line
- Select Local Data Filter and select the X value to be filtered
Here are the results with my example data
Note that under the Parameter Estimates you can see the slope of .0038645
Now all you have to do, is to use the Data Filter to select only the values on the left side of the graph.
The regression now is only calculated on the down slope, which is -0.490244
- Mark as New
- Bookmark
- Subscribe
- Mute
- Subscribe to RSS Feed
- Get Direct Link
- Report Inappropriate Content
Re: Slopes
If you know the function of the curves or just do bivariate fit -spline fit and then save the prediction formula. Then do the derivative of the curve function under formula editor, screen shot below. you will have slopes at any Xs.
- Mark as New
- Bookmark
- Subscribe
- Mute
- Subscribe to RSS Feed
- Get Direct Link
- Report Inappropriate Content
Re: Slopes
I tried this but it is giving multiple values for each date but I want just one that explains the drop...
- Mark as New
- Bookmark
- Subscribe
- Mute
- Subscribe to RSS Feed
- Get Direct Link
- Report Inappropriate Content
Re: Slopes
you can make a plot of dy/dx vs x. you can find where dy/dx=0, that's where y starts from decrease to increase in my example below.
- Mark as New
- Bookmark
- Subscribe
- Mute
- Subscribe to RSS Feed
- Get Direct Link
- Report Inappropriate Content
Re: Slopes
- Mark as New
- Bookmark
- Subscribe
- Mute
- Subscribe to RSS Feed
- Get Direct Link
- Report Inappropriate Content
Re: Slopes
Recommended Articles
- © 2026 JMP Statistical Discovery LLC. All Rights Reserved.
- Terms of Use
- Privacy Statement
- Contact Us


