- Subscribe to RSS Feed
- Mark Topic as New
- Mark Topic as Read
- Float this Topic for Current User
- Bookmark
- Subscribe
- Mute
- Printer Friendly Page
Discussions
Solve problems, and share tips and tricks with other JMP users.- JMP User Community
- :
- Discussions
- :
- Scatterplot Matrix - Group doesn't work
- Mark as New
- Bookmark
- Subscribe
- Mute
- Subscribe to RSS Feed
- Get Direct Link
- Report Inappropriate Content
Scatterplot Matrix - Group doesn't work
Greetings,
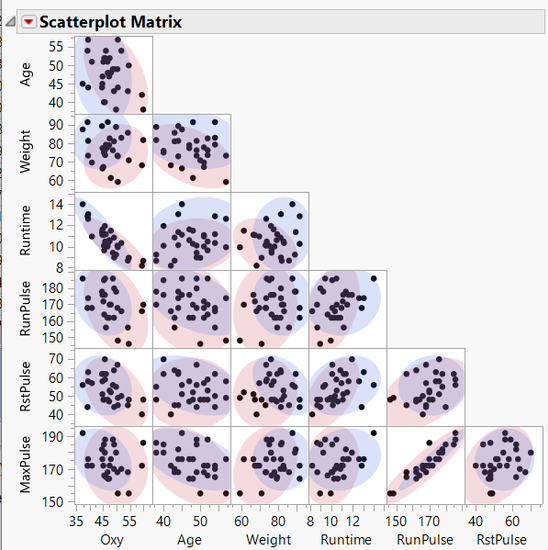
I'm having trouble with the Scatterplot Matrix Group option working consistently in JMP 16.0.0. See examples below. It works fine if I group by Species as in the help file example using Iris sample data. But it doesn't work if I use the Fitness sample data, trying to group by Sex. I must be missing something simple here but I can't find it. In both cases I'm using a Character Nominal column as the grouping variable. I got here because it doesn't work in the dataset I'm analyzing and was surprised to quickly find an example datafile that replicates the problem.
Thanks,
Tom
Accepted Solutions
- Mark as New
- Bookmark
- Subscribe
- Mute
- Subscribe to RSS Feed
- Get Direct Link
- Report Inappropriate Content
Re: Scatterplot Matrix - Group doesn't work
There might be a misunderstanding of what the Group feature does.
From the JMP help:
So it is designed to give you different density ellipses, which I don't see on your pictures. The dots are colored from the Iris data because the row states were already established. I worked with the Fitness data and the grouping worked fine once I asked for the density ellipses.
- Mark as New
- Bookmark
- Subscribe
- Mute
- Subscribe to RSS Feed
- Get Direct Link
- Report Inappropriate Content
Re: Scatterplot Matrix - Group doesn't work
Dan, Your comment about the row states seems to be the clue to making it work. Manually setting the "color or mark by column" feature in the data table is the key. The Group variable isn't needed for simply coloring the points.The density ellipses are indeed another feature, and I'm not needing that right now.
Thanks,
- Tom
Recommended Articles
- © 2026 JMP Statistical Discovery LLC. All Rights Reserved.
- Terms of Use
- Privacy Statement
- Contact Us


