Turn on suggestions
Auto-suggest helps you quickly narrow down your search results by suggesting possible matches as you type.
Options
- Subscribe to RSS Feed
- Mark Topic as New
- Mark Topic as Read
- Float this Topic for Current User
- Bookmark
- Subscribe
- Mute
- Printer Friendly Page
Discussions
Solve problems, and share tips and tricks with other JMP users.- JMP User Community
- :
- Discussions
- :
- Overlay Issue when plotting multiple variables in Graph Builder
- Mark as New
- Bookmark
- Subscribe
- Mute
- Subscribe to RSS Feed
- Get Direct Link
- Report Inappropriate Content
Overlay Issue when plotting multiple variables in Graph Builder
Created:
Feb 2, 2020 11:32 AM
| Last Modified: Feb 3, 2020 12:31 AM
(3197 views)
Hi all,
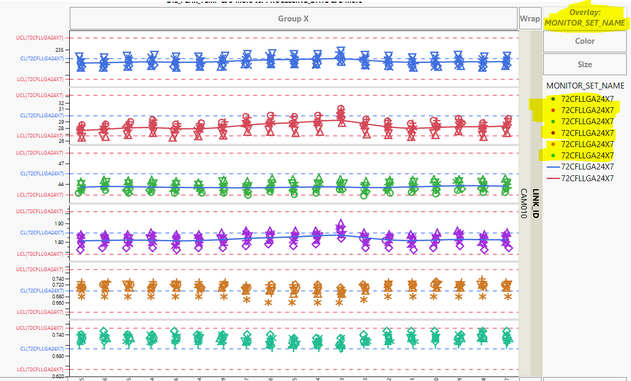
I have actually a big issue with overlay function in Graph Builder. In fact, My variable used for Overlay function has only one level but Graph Builder somehow creates different colors for only one level as you can see in the attached image. Could you please help me troubleshoot this problem?
Thank you in advance.
1 ACCEPTED SOLUTION
Accepted Solutions
- Mark as New
- Bookmark
- Subscribe
- Mute
- Subscribe to RSS Feed
- Get Direct Link
- Report Inappropriate Content
Re: Overlay Issue when plotting multiple variables in Graph Builder
I think that you should contact JMP Technical Support (support@jmp.com) about this problem.
4 REPLIES 4
- Mark as New
- Bookmark
- Subscribe
- Mute
- Subscribe to RSS Feed
- Get Direct Link
- Report Inappropriate Content
Re: Overlay Issue when plotting multiple variables in Graph Builder
Did you verify that the overlay variable has only one level? For example, put it in the Y role in Distribution?
And if it has only one level, why would you use it in the Overlay role of Graph Builder?
- Mark as New
- Bookmark
- Subscribe
- Mute
- Subscribe to RSS Feed
- Get Direct Link
- Report Inappropriate Content
Re: Overlay Issue when plotting multiple variables in Graph Builder
I have several charts which are separated by By. Some charts have one level, the others have more than one. It works perfectly for 2 variables or more (ex: 2 colors for2 levels) but for one level it is not the same as you can see in my attached image, can you give me some advices?
- Mark as New
- Bookmark
- Subscribe
- Mute
- Subscribe to RSS Feed
- Get Direct Link
- Report Inappropriate Content
Re: Overlay Issue when plotting multiple variables in Graph Builder
I think that you should contact JMP Technical Support (support@jmp.com) about this problem.
- Mark as New
- Bookmark
- Subscribe
- Mute
- Subscribe to RSS Feed
- Get Direct Link
- Report Inappropriate Content
Re: Overlay Issue when plotting multiple variables in Graph Builder
It could be the best solution, thank Mark.
Recommended Articles
- © 2026 JMP Statistical Discovery LLC. All Rights Reserved.
- Terms of Use
- Privacy Statement
- Contact Us

