Turn on suggestions
Auto-suggest helps you quickly narrow down your search results by suggesting possible matches as you type.
- JMP Statement Regarding Critical PHP Remote Code Execution Vulnerabilities (CVE-2026-109618, CVE-2026-109619)
- Don’t miss your chance to experience Discovery Summit Europe at our best available rate! Early bird registration through 31 Oct.
- Graph Builder Toolbar streamlines interactive graphing. Creates shortcuts on Report and GraphBuilder Helpers toolbars. Download and install the extension.
Options
- Subscribe to RSS Feed
- Mark Topic as New
- Mark Topic as Read
- Float this Topic for Current User
- Bookmark
- Subscribe
- Mute
- Printer Friendly Page
Discussions
Solve problems, and share tips and tricks with other JMP users.- User Community
- :
- Discussions
- :
- Ordering the Y groups in the Graph Builder

Level VII
- Mark as New
- Bookmark
- Subscribe
- Mute
- Subscribe to RSS Feed
- Get Direct Link
- Report Inappropriate Content
Ordering the Y groups in the Graph Builder
Sep 6, 2023 02:31 PM
(1917 views)
Hi,
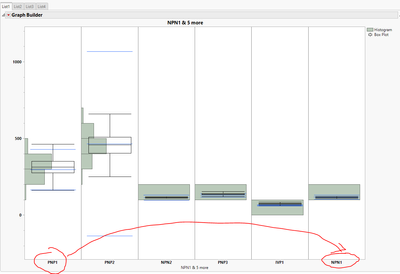
I have the following jsl script that populated GB plots based on the list's column values. The problem is that the plot's ordering is incorrect for some reason.
Eg list 1 has the columns in the following order:
List1 = {"NPN1", "PNP1", "PNP2", "NPN2", "PNP3", "IVP1"};
The loop swaps 1st column to the last; see below. Is there a workaround?
Names Default To Here( 1 );

dt = Open( "$SAMPLE_DATA/Semiconductor Capability.jmp" );

List1 = {"NPN1", "PNP1", "PNP2", "NPN2", "PNP3", "IVP1"};
List2 = {"PNP4", "NPN3", "IVP2", "NPN4", "SIT1"};
List3 = {"INM1", "INM2", "VPM1", "VPM2", "VPM3"};
List4 = {"SNM1", "SPM1", "NPN5", "EP2", "ZD6"};

var expr1 = Expr( Variables() );
For( c = 1, c <= N Items( List1 ), c++,
	x expr1 = Expr(
		X( Position( 1 ), Combine( "Parallel Merged" ) )
	);
	Insert Into( x expr1, List1[c], 1 );
	Insert Into( var expr1, Name Expr( x expr1 ) );
);

var expr2 = Expr( Variables() );
For( c = 1, c <= N Items( List2 ), c++,
	x expr2 = Expr(
		X( Position( 1 ), Combine( "Parallel Merged" ) )
	);
	Insert Into( x expr2, List2[c], 1 );
	Insert Into( var expr2, Name Expr( x expr2 ) );
);

var expr3 = Expr( Variables() );
For( c = 1, c <= N Items( List3 ), c++,
	x expr3 = Expr(
		X( Position( 1 ), Combine( "Parallel Merged" ) )
	);
	Insert Into( x expr3, List3[c], 1 );
	Insert Into( var expr3, Name Expr( x expr3 ) );
);

var expr4 = Expr( Variables() );
For( c = 1, c <= N Items( List4 ), c++,
	x expr4 = Expr(
		X( Position( 1 ), Combine( "Parallel Merged" ) )
	);
	Insert Into( x expr4, List4[c], 1 );
	Insert Into( var expr4, Name Expr( x expr4 ) );
);


lists = {"List1", "List2", "List3", "List4"};
var = {};
gbv = {};

For( i = 1, i <= 4, i++,
	Insert Into( var, Name Expr( Eval( Parse( "var expr" || Char( i ) ) ) ) );
	Insert Into( gbv, Parse( "vvv" || Char( i ) ) );
);

nw = New Window( "Plots", Show Menu( 0 ), show toolbars( 0 ), tb = Tab Box() );

For( i = 1, i <= N Items( lists ), i++,
	tb << Add(
		lists[i],
		V List Box(
			H List Box(
				Eval(
					Eval Expr(
					gb=	dt << Graph Builder(
							Size( 1117, 781 ),
							Show Control Panel( 0 ),
						////something is not correct here?????
							Expr( Name Expr( var[i] ) ),
							Elements(
								Histogram(
									X( 2 ),
									X( 3 ),
									X( 4 ),
									X( 5 ),
									X( 6 ),
									X( 7 ),
									X( 8 ),
									X( 9 ),
									X( 10 ),
									X( 11 ),
									X( 12 ),
									X( 13 ),
									X( 14 ),
									X( 15 ),
									X( 16 ),
									X( 1 ),
									Legend( 2 ),

								),
								Box Plot(
									X( 2 ),
									X( 3 ),
									X( 4 ),
									X( 5 ),
									X( 6 ),
									X( 7 ),
									X( 8 ),
									X( 9 ),
									X( 10 ),
									X( 11 ),
									X( 12 ),
									X( 13 ),
									X( 14 ),
									X( 15 ),
									X( 16 ),
									X( 1 ),
									Legend( 3 ),
									Outliers( 0 )
								)
							)
						)
					)
				),
				Tabulate(
					Show Control Panel( 0 ),
					Set Format( Uniform Format( 10, 2 ) ),
					Add Table(
						Column Table( Statistics( Mean, Std Dev ) ),
						Row Table(
							Analysis Columns(
								Eval( Parse( lists[i] ) )

							)
						)
					)
				)
			)
		)
	);


);
Thanks,
Jackie
1 ACCEPTED SOLUTION
Accepted Solutions


Super User
Solution
- Mark as New
- Bookmark
- Subscribe
- Mute
- Subscribe to RSS Feed
- Get Direct Link
- Report Inappropriate Content
Re: Ordering the Y groups in the Graph Builder
Take a look at the script which Graph Builder provides you with
Graph Builder(
	Size(1117, 781),
	Show Control Panel(0),
	Variables(
		X(:NPN1, Combine("Parallel Merged")),
		X(:PNP1, Position(1), Combine("Parallel Merged")),
		X(:PNP2, Position(1), Combine("Parallel Merged")),
		X(:NPN2, Position(1), Combine("Parallel Merged")),
		X(:PNP3, Position(1), Combine("Parallel Merged")),
		X(:IVP1, Position(1), Combine("Parallel Merged"))
	),
	Elements(
		Histogram(X(2), X(3), X(4), X(5), X(6), X(1), Legend(2)),
		Box Plot(X(2), X(3), X(4), X(5), X(6), X(1), Legend(3), Outliers(0))
	),
	SendToReport(
		Dispatch(
			{},
			"Graph Builder",
			FrameBox,
			{DispatchSeg(Hist Seg("Histogram (NPN2)"), Bin Span(1500, 240)),
			DispatchSeg(Hist Seg("Histogram (PNP3)"), Bin Span(750, 300)),
			DispatchSeg(Hist Seg("Histogram (IVP1)"), Bin Span(750, 150)),
			DispatchSeg(Hist Seg("Histogram (NPN1)"), Bin Span(240, 24))}
		)
	)
)
X(1) is the last one. Same thing with your Graph Builder Script

-Jarmo
1 REPLY 1
Super User
Solution
- Mark as New
- Bookmark
- Subscribe
- Mute
- Subscribe to RSS Feed
- Get Direct Link
- Report Inappropriate Content
Re: Ordering the Y groups in the Graph Builder
Take a look at the script which Graph Builder provides you with
Graph Builder(
	Size(1117, 781),
	Show Control Panel(0),
	Variables(
		X(:NPN1, Combine("Parallel Merged")),
		X(:PNP1, Position(1), Combine("Parallel Merged")),
		X(:PNP2, Position(1), Combine("Parallel Merged")),
		X(:NPN2, Position(1), Combine("Parallel Merged")),
		X(:PNP3, Position(1), Combine("Parallel Merged")),
		X(:IVP1, Position(1), Combine("Parallel Merged"))
	),
	Elements(
		Histogram(X(2), X(3), X(4), X(5), X(6), X(1), Legend(2)),
		Box Plot(X(2), X(3), X(4), X(5), X(6), X(1), Legend(3), Outliers(0))
	),
	SendToReport(
		Dispatch(
			{},
			"Graph Builder",
			FrameBox,
			{DispatchSeg(Hist Seg("Histogram (NPN2)"), Bin Span(1500, 240)),
			DispatchSeg(Hist Seg("Histogram (PNP3)"), Bin Span(750, 300)),
			DispatchSeg(Hist Seg("Histogram (IVP1)"), Bin Span(750, 150)),
			DispatchSeg(Hist Seg("Histogram (NPN1)"), Bin Span(240, 24))}
		)
	)
)
X(1) is the last one. Same thing with your Graph Builder Script
-Jarmo
Recommended Articles
- © 2026 JMP Statistical Discovery LLC. All Rights Reserved.
- Terms of Use
- Privacy Statement
- Contact Us