This website uses Cookies. Click Accept to agree to our website's cookie use as described in our Privacy Policy. Click Preferences to customize your cookie settings.
- JMP User Community
- :
- Discussions
- :
- Re: Obtaining Log-Log Survival plots in JMP
Turn on suggestions
Auto-suggest helps you quickly narrow down your search results by suggesting possible matches as you type.
Submit your abstract to the call for content for Discovery Summit Americas by April 23. Selected abstracts will be presented at Discovery Summit, Oct. 21- 24.
Discovery is online this week, April 16 and 18. Join us for these exciting interactive sessions.
Topic Options
- Subscribe to RSS Feed
- Mark Topic as New
- Mark Topic as Read
- Float this Topic for Current User
- Bookmark
- Subscribe
- Printer Friendly Page

Level II
- Mark as New
- Bookmark
- Subscribe
- Mute
- Subscribe to RSS Feed
- Get Direct Link
- Report Inappropriate Content
Obtaining Log-Log Survival plots in JMP
Created:
Sep 28, 2020 05:57 PM
| Last Modified: Jun 11, 2023 07:06 AM
(2634 views)
Hello everyone ... was hoping you could give me a couple pointers on an analysis.
I've got a dataset with a survival time, a censor column, and some other variables. I'm trying to get the log-log survival plot from the dataset and I'm not sure where this chart is generated. I can generate the Product Limit (Kaplan) plot but I don't see anything there to explore out to the Log-Log. Any ideas?
10 REPLIES 10

Level III
- Mark as New
- Bookmark
- Subscribe
- Mute
- Subscribe to RSS Feed
- Get Direct Link
- Report Inappropriate Content
Re: Obtaining Log-Log Survival plots in JMP
Hi @NathanFisk Have you tried Fit Parametric Survival platform? It is under Analyze -> Reliability and Survival -> Fit Parametric Survival. Or Fit Life by X platform, under Analyze -> Reliability and Survival -> Fit Life by X, you can get distribution profiler.
Level II
- Mark as New
- Bookmark
- Subscribe
- Mute
- Subscribe to RSS Feed
- Get Direct Link
- Report Inappropriate Content
Re: Obtaining Log-Log Survival plots in JMP
I've tried the Fit Parametric Survival function and can't seem to find any way to create survival and survival log-log plots. It'll do a residual probability plot, but it won't do the survival step plot. Not that I can find anyway.
The file has SurvivalTime and Censoring plots and there is a categorical variable "Therapy" for those that had a treatment. I'm trying to get the comparative survival plots for both those who got the therapy and those who didn't accounting for covariates X and Y. Fit Parametric Survival sounds right, but hopefully someone knows how to cox out those survival plots.
Level III
- Mark as New
- Bookmark
- Subscribe
- Mute
- Subscribe to RSS Feed
- Get Direct Link
- Report Inappropriate Content
Re: Obtaining Log-Log Survival plots in JMP
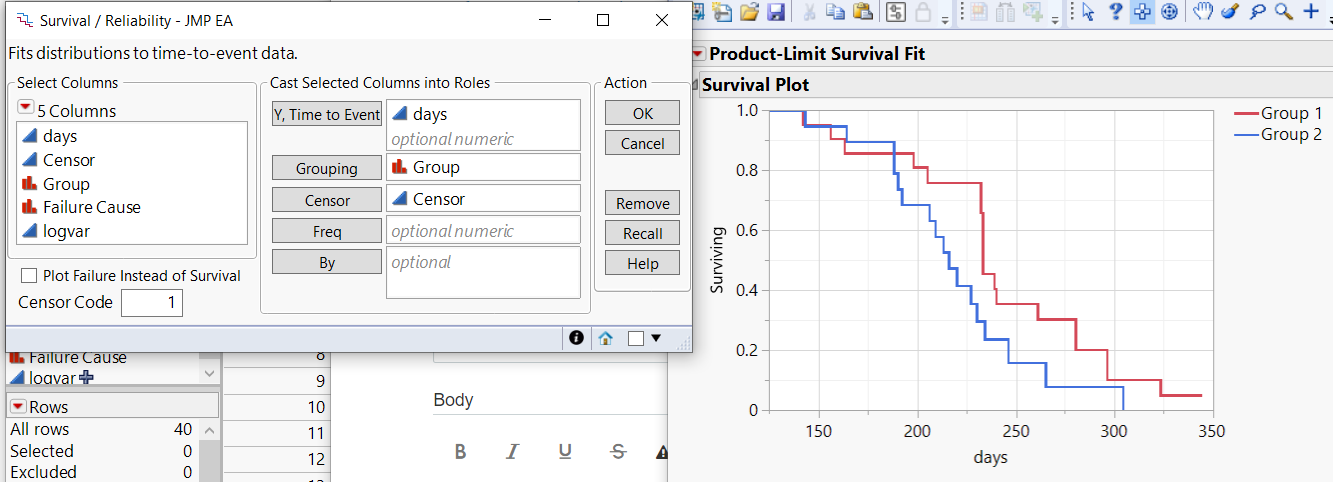
Try the survival analysis under Reliability and Survival, see attached screen shots, it will provide overlaid survival plots of two groups.
Level II
- Mark as New
- Bookmark
- Subscribe
- Mute
- Subscribe to RSS Feed
- Get Direct Link
- Report Inappropriate Content
Re: Obtaining Log-Log Survival plots in JMP
I've done these basic survival plots that take the treatment variable and create the survival plot for that one variable.
What I'm trying to do now is to get ADJUSTED survival plots and the Log-Log plot that accounts for two covariates after doing the "Fit Proportional Hazards" function and getting the Cox model.
So in the Fit Proportional Hazards" function of the Survival
So the setup is that I've got the Survival variable ... which I put into the "Time to Event" role.
Then I have the Status variable ... which I put into the "Censor" role.
Then I have the Treatment variable ... which I put into the "By" role.
Then I put the covariates into the "Construct Model Effects" box and run the analysis. I can't find a way to get this to generate an adjusted survival plot or a Log-Log survival plot.

Staff
- Mark as New
- Bookmark
- Subscribe
- Mute
- Subscribe to RSS Feed
- Get Direct Link
- Report Inappropriate Content
Re: Obtaining Log-Log Survival plots in JMP
I suggest that you try the Life Distribution platform available from the Reliability and Survival menu. You select a model using the check boxes in front of the model name and a transformation of scales based on the radio buttons after the model name.
You can also generally plot any data using Graph Builder. You can right-click on the Y and X axes and select Axis Settings. The log scale is one of the options.
Level II
- Mark as New
- Bookmark
- Subscribe
- Mute
- Subscribe to RSS Feed
- Get Direct Link
- Report Inappropriate Content
Re: Obtaining Log-Log Survival plots in JMP
Created:
Sep 29, 2020 11:29 AM
| Last Modified: Sep 29, 2020 11:31 AM
(2367 views)
| Posted in reply to message from Mark_Bailey 09-29-2020

Hi Mark, thanks for weighing in.
I have performed the Life analysis as you've suggested and obtained curves. However, I am not seeing any method in the Life Analysis that will create an adjusted graph which accounts for covariates.
In the image I have created the graph using SURVT as the survival time and I set up the censorship variable and compared the two Treatment Groups (PRIORX). This creates the basic Kaplan survival curve and I can select different models on the left ... one of which is the loglogistic (which I think is the same thing as the Log-Log survival curve).
The question is ... how do I get this to adjust for covariates? There are two covariates I want the graph to account for and I'm not seeing any way to put those two covariates into the analysis except if I use the Fit Proportional Hazards tool ... but that doesn't generate the survival plots.
Staff
- Mark as New
- Bookmark
- Subscribe
- Mute
- Subscribe to RSS Feed
- Get Direct Link
- Report Inappropriate Content
Re: Obtaining Log-Log Survival plots in JMP
I think that that the log-log plot is a change of axes (transformation of variables). I do not think that it is the same as the loglogistic distribution model. See this model here.
I am sorry about the confusion regarding two covariates. You can use the proportional hazards model (if the assumption holds) or the parametric survival model (with the proper life distribution) and then use the profilers for visualization.
Staff
- Mark as New
- Bookmark
- Subscribe
- Mute
- Subscribe to RSS Feed
- Get Direct Link
- Report Inappropriate Content
Re: Obtaining Log-Log Survival plots in JMP
Perhaps try the Fit Life by X platform. Put your covariate in the X role. Otherwise, the set up is the same.
Also, when you say log-log plot, what are the variables in the abscissa and ordinate of the plot? And why is the log-log plot useful? We might find another solution through a few extra steps.
Level II
- Mark as New
- Bookmark
- Subscribe
- Mute
- Subscribe to RSS Feed
- Get Direct Link
- Report Inappropriate Content
Re: Obtaining Log-Log Survival plots in JMP
Created:
Sep 29, 2020 01:38 PM
| Last Modified: Sep 29, 2020 04:16 PM
(2335 views)
| Posted in reply to message from Mark_Bailey 09-29-2020
FitLife by X does not seem to allow for multiple covariates and so accounting for both of the covariates in the same model doesn't sound like it would work with this method.
I've enclosed the file below. I'm trying to get adjusted survival and adjusted log-log survival plots for both of the "Prior" groups with "TRT" and "Perform" as simultaneous adjusting covariates.
I figure there has to be something like this in JMP somewhere because just about every other platform I've ever seen will automatically generate survival plots when a Cox Proportional Hazard model is run. It's odd that such plots don't seem to be standard process for the JMP Cox PH function so I assume I'm doing something wrong and missing something obvious.
- © 2024 JMP Statistical Discovery LLC. All Rights Reserved.
- Terms of Use
- Privacy Statement
- About JMP
- JMP Software
- JMP User Community
- Contact