- Learn how to build custom Python data connectors and further customize JMP’s Data Connector Framework with the Python Data Connector Demo, available now in the JMP Marketplace!
- See how to use Accelerated Life Testing (ALT) to evaluate reliability. Register for June 5 webinar, 2pm US Eastern Time.
- Subscribe to RSS Feed
- Mark Topic as New
- Mark Topic as Read
- Float this Topic for Current User
- Bookmark
- Subscribe
- Mute
- Printer Friendly Page
Discussions
Solve problems, and share tips and tricks with other JMP users.- JMP User Community
- :
- Discussions
- :
- Re: Multinomial logistic regression output interpretation

- Mark as New
- Bookmark
- Subscribe
- Mute
- Subscribe to RSS Feed
- Get Direct Link
- Report Inappropriate Content
Multinomial logistic regression output interpretation
I am using a Mac computer with JMP Pro 16.0.0
I have an experiment where I have tested three tool depths and three tool speeds in a full factorial design. My response variables are score categories for level of disturbance of artificial weeds. The categories are uprooted, disturbed, buried, partially disturbed, and undisturbed. I am using a multinomial logistic regression in JMP to analyze this data. My fit model is: Score Category as my response variable and I have Tool Depth, Speed, and Tool Depth*Speed as my fixed effects. I see that my likelihood ratio test is significant for both main effects and the interaction. My question is about understanding my Parameter Estimates output. I can calculate my Lin[uprooted], Lin[disturbed], etc. from the contingency table, but not from the parameter estimates.
I need to understand how to put my p-values into sentences from my parameter estimates table and how to calculate my log odds from the same table so I understand what the test is telling me. I have attached my dataset down below for more understanding.
- Tags:
- macOS
Accepted Solutions

- Mark as New
- Bookmark
- Subscribe
- Mute
- Subscribe to RSS Feed
- Get Direct Link
- Report Inappropriate Content
Re: Multinomial logistic regression output interpretation
No. The Parameter Estimates table tests each estimate against the null hypothesis that the true parameter equals zero. That is all it tells you.
You might use other information to interpret the meaning of these effects. For example, the Prediction Profiler allows you to change the settings and see the updated predicted probability for each of the response levels. I do not have an example like yours. I used Big Class and fit the nominal response Age against the continuous Weight and Height predictors. Here is the profiler for this model:

You can also save the probability formulas. JMP saves the linear predictor, the transformed probabilities, and the most likely level given the probabilities. Here is the group of linear predictors for the log odds.

Here is the formula for the first linear predictor:

The numbers are the parameter estimates. The next group of formula columns transforms the log odds back to probability:

Here is the formula for the first probability transformation:

Finally, the predicted response level is the response level with the highest probability:

- Mark as New
- Bookmark
- Subscribe
- Mute
- Subscribe to RSS Feed
- Get Direct Link
- Report Inappropriate Content
Re: Multinomial logistic regression output interpretation
Did you try to save the model as a series of formulae?
- Mark as New
- Bookmark
- Subscribe
- Mute
- Subscribe to RSS Feed
- Get Direct Link
- Report Inappropriate Content
Re: Multinomial logistic regression output interpretation
Yes, I used the Save Probability Formula option and I am able to get my log odds from this. Although, I would like the associated p-value with the log odds from the Parameter Estimates.
- Mark as New
- Bookmark
- Subscribe
- Mute
- Subscribe to RSS Feed
- Get Direct Link
- Report Inappropriate Content
Re: Multinomial logistic regression output interpretation
I will try re-framing my question. I need help breaking down the parameter estimate table when I have two, three level effects and an interaction. For example, in the Term column I have tool depth (30 mm) and a significant p-value. Does that mean all of the three speeds that contain a 30 mm depth are significantly different when compared to a 10 mm depth containing all three speeds for Disturbed/Undisturbed scoring? Furthermore, in the Term column I have tool depth 30 mm*speed 1.1 m/s showing significance. Does this mean that tool depth 30 mm at a speed of 1.1 m/s is significantly different from a tool depth of 10 mm and a speed of 0.89. m/s for Disturbed/Undisturbed scoring? I have attached a photo showing this table.
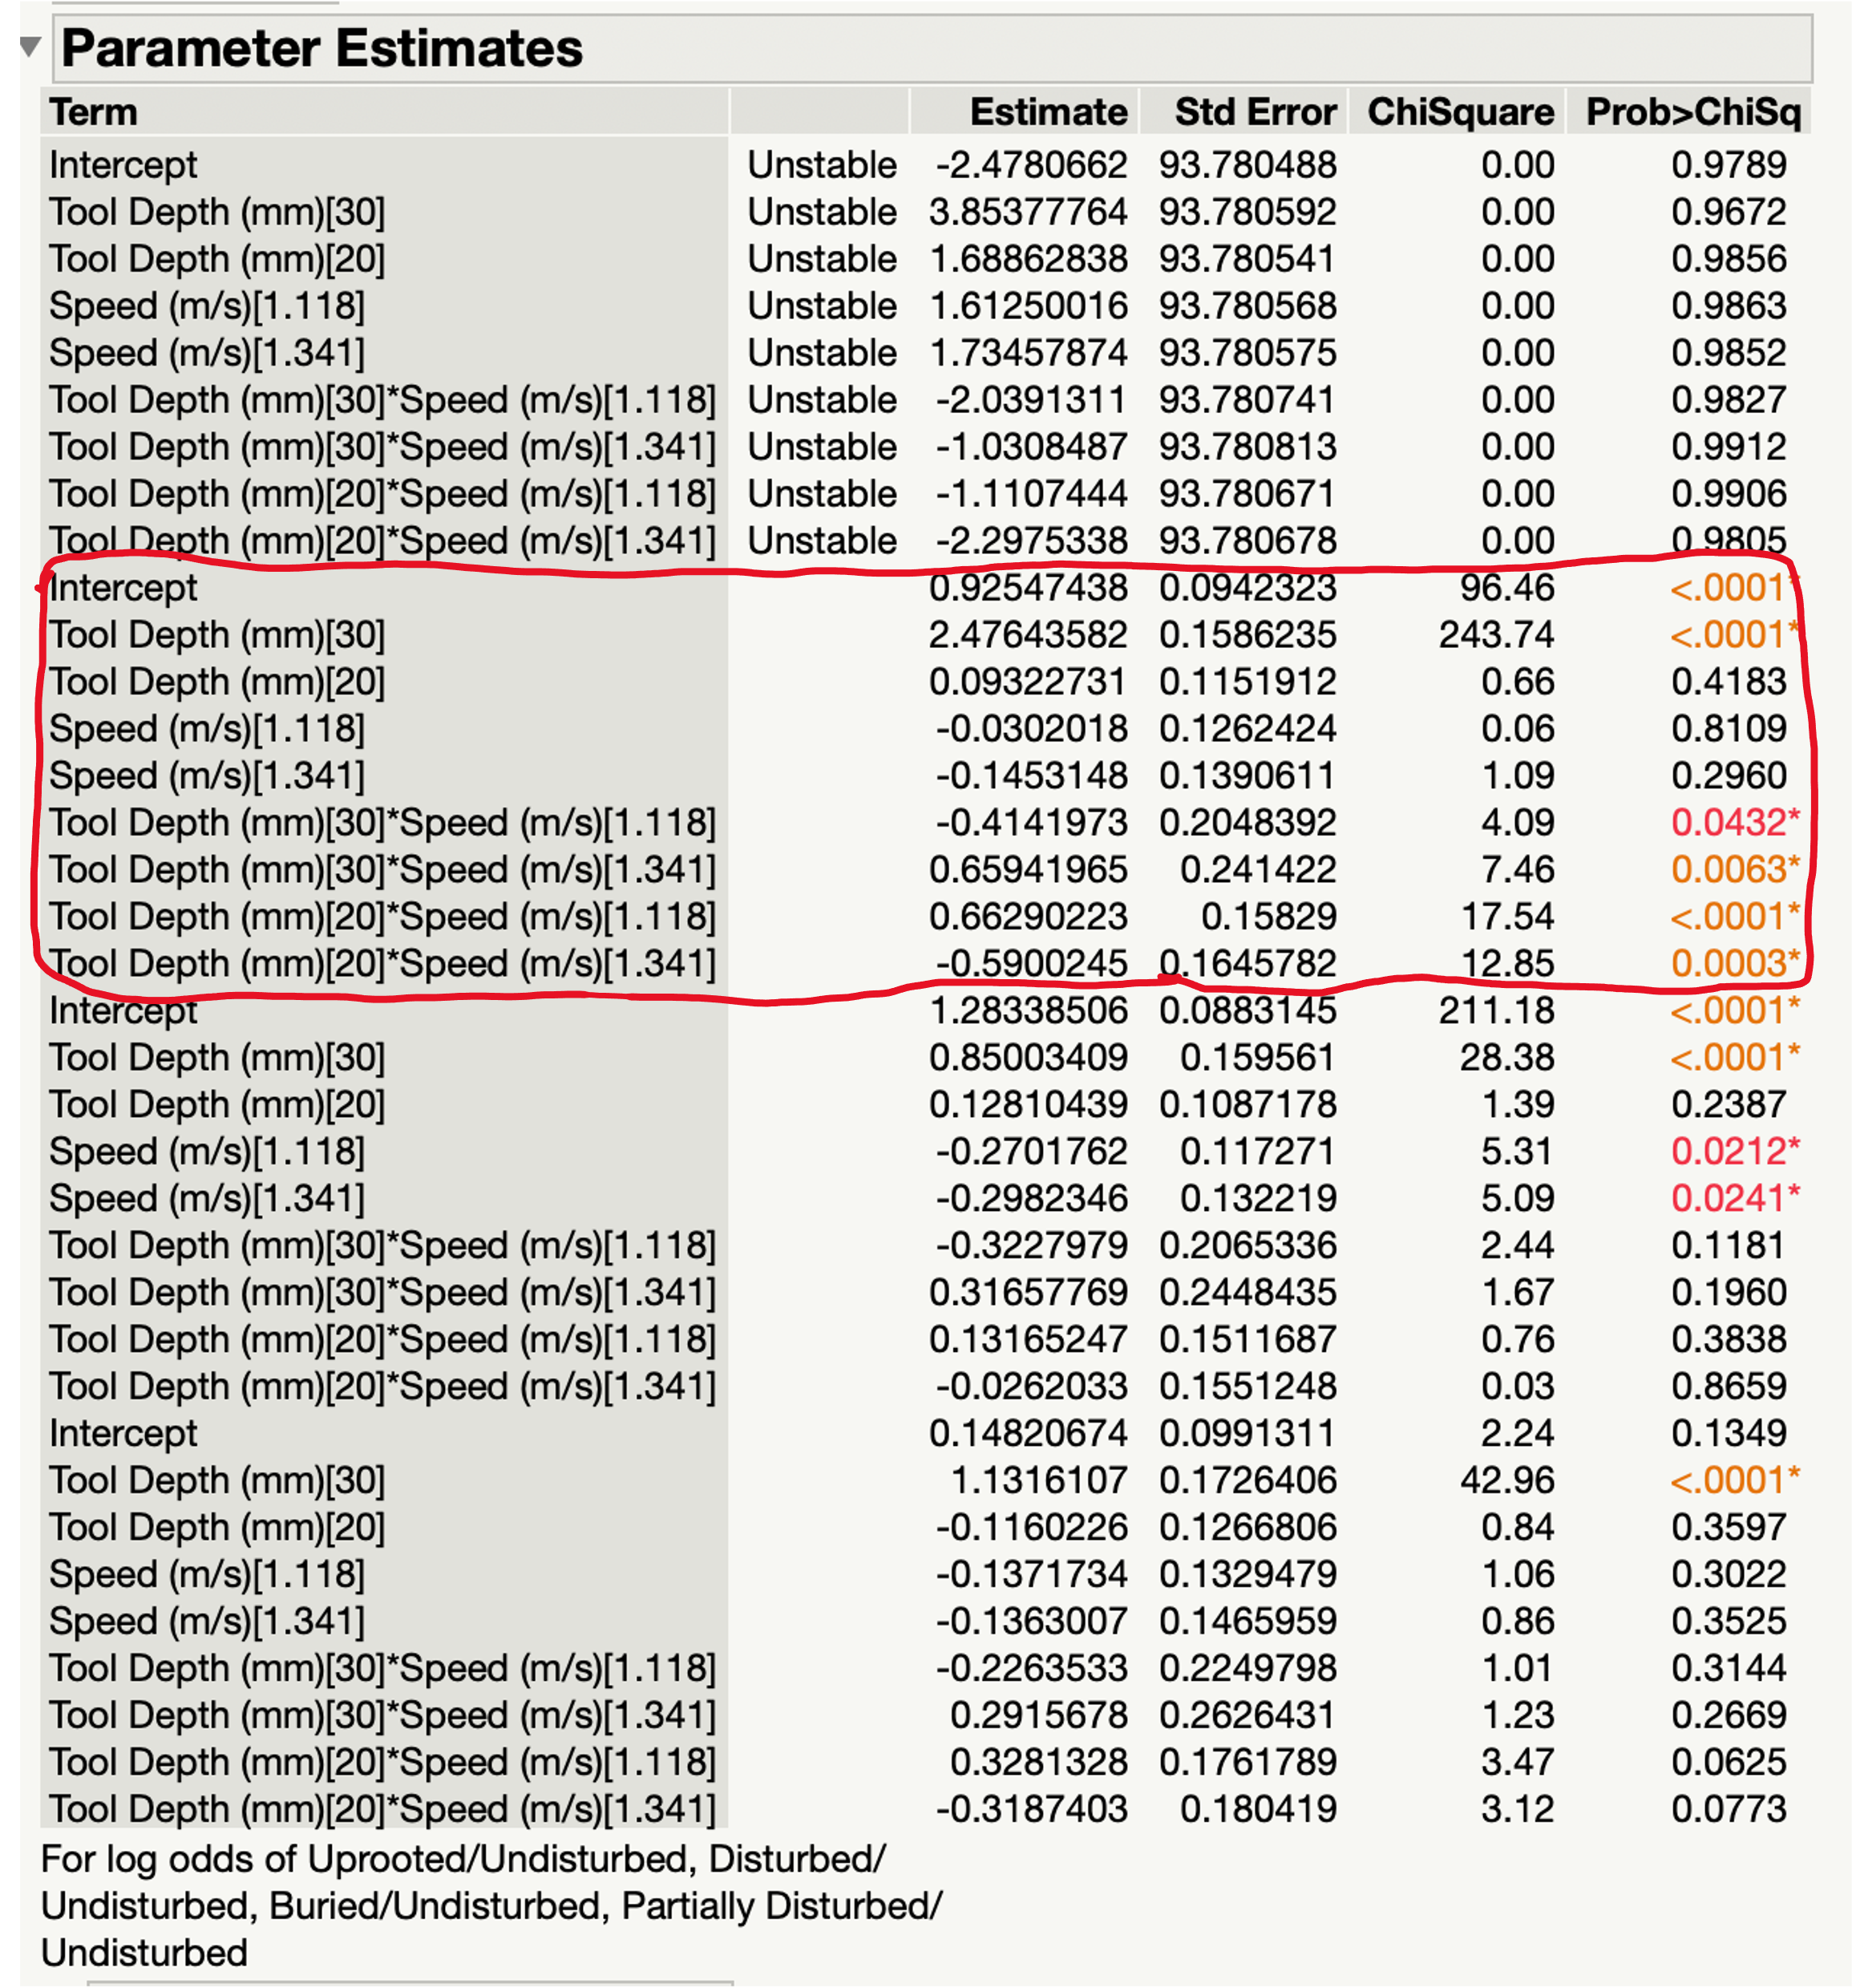
- Mark as New
- Bookmark
- Subscribe
- Mute
- Subscribe to RSS Feed
- Get Direct Link
- Report Inappropriate Content
Re: Multinomial logistic regression output interpretation
No. The Parameter Estimates table tests each estimate against the null hypothesis that the true parameter equals zero. That is all it tells you.
You might use other information to interpret the meaning of these effects. For example, the Prediction Profiler allows you to change the settings and see the updated predicted probability for each of the response levels. I do not have an example like yours. I used Big Class and fit the nominal response Age against the continuous Weight and Height predictors. Here is the profiler for this model:
You can also save the probability formulas. JMP saves the linear predictor, the transformed probabilities, and the most likely level given the probabilities. Here is the group of linear predictors for the log odds.
Here is the formula for the first linear predictor:
The numbers are the parameter estimates. The next group of formula columns transforms the log odds back to probability:
Here is the formula for the first probability transformation:
Finally, the predicted response level is the response level with the highest probability:
- Mark as New
- Bookmark
- Subscribe
- Mute
- Subscribe to RSS Feed
- Get Direct Link
- Report Inappropriate Content
Re: Multinomial logistic regression output interpretation
Okay, I see how the parameter estimates are used. Now I understand where the equation comes from. This helps a lot, thank you I appreciate it. I will explore more with the profiler as well.
Recommended Articles
- © 2026 JMP Statistical Discovery LLC. All Rights Reserved.
- Terms of Use
- Privacy Statement
- Contact Us