- Subscribe to RSS Feed
- Mark Topic as New
- Mark Topic as Read
- Float this Topic for Current User
- Bookmark
- Subscribe
- Mute
- Printer Friendly Page
Discussions
Solve problems, and share tips and tricks with other JMP users.- JMP User Community
- :
- Discussions
- :
- Local data filter on different parts of the data
- Mark as New
- Bookmark
- Subscribe
- Mute
- Subscribe to RSS Feed
- Get Direct Link
- Report Inappropriate Content
Local data filter on different parts of the data
Is there a possibility to apply a fit line on each data segment separately, so a line each on large, medium and small. With data filter I could only apply a fit if I present the graph separately. But I don't want that, I want all the bars and the fit line in the same grid. I hope someone can help.
- Mark as New
- Bookmark
- Subscribe
- Mute
- Subscribe to RSS Feed
- Get Direct Link
- Report Inappropriate Content
Re: Local data filter on different parts of the data
Are you looking for something like this?
If so, you can use the Cols > Utilities > Labels to Codes tool to assign numeric values to each category. After that, change the X axis variable to continuous, and the line span the "categories."
- Mark as New
- Bookmark
- Subscribe
- Mute
- Subscribe to RSS Feed
- Get Direct Link
- Report Inappropriate Content
Re: Local data filter on different parts of the data
I'm not sure if I'm understanding the question fully. Are you looking for the linear fit for (a) Dissolution vs Particle Size (grouped by Screen Size), or (b) Dissolution vs Screen Size (grouped by Particle Size).
Jed's response above is best for case (a).
If case (b), change Screen Size to Numeric/Continuous, plot Dissolution vs Screen Size, and drag API Particle Size to Group X.
- Mark as New
- Bookmark
- Subscribe
- Mute
- Subscribe to RSS Feed
- Get Direct Link
- Report Inappropriate Content
Re: Local data filter on different parts of the data
HI Christian,
Thanks for your response. Its as close as it gets. I am fitting a polynomial on the data, not a linear one. Although I could arrange the data like you did putting numerical on x-axis, the poly fit is however not possible. Also Ideally I would like to keep the AP particle size on the x-axis. Anyhow, i can do something with the data to present it in a different way. thanks for your answer.
- Mark as New
- Bookmark
- Subscribe
- Mute
- Subscribe to RSS Feed
- Get Direct Link
- Report Inappropriate Content
Re: Local data filter on different parts of the data
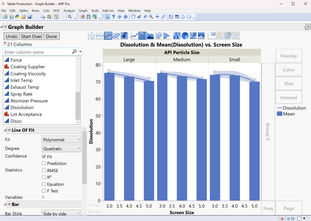
I see, I think I understand your question better now. The reason the example Tablet Production data set won't allow a polynomial fit is because the Screen Size data has a modeling type of Nominal. If you change that to Continuous, then a polynomial fit is possible. See the lower left portion of the image below -> change the degree of the fit to quadratic, for example, to get a quadratic fit instead of linear.
As long as your data type is numeric, and it makes sense to set the modeling type to Continuous, then a polynomial fit is possible.
(Note that you will want to use the Line of Fit graph for this, not the Smoother. These two options have similar looking icons but work very differently, especially for continuous vs nominal data.)
- Mark as New
- Bookmark
- Subscribe
- Mute
- Subscribe to RSS Feed
- Get Direct Link
- Report Inappropriate Content
Re: Local data filter on different parts of the data
Regarding your request to have the API Particle Size as the X-Aixs, that is tricky. Because Particle Size is not a number, but a category, it is not possible to make a polynomial fit with it. The X-Axis needs to be a number.
If it's just a matter of moving the labels to the bottom of the graph instead of the top, that can be done by right-clicking on the group labels and selecting X Group Edge -> Bottom.
- Mark as New
- Bookmark
- Subscribe
- Mute
- Subscribe to RSS Feed
- Get Direct Link
- Report Inappropriate Content
Re: Local data filter on different parts of the data
Hi Jed
Thanks for your time. the solution you proposed is not what I look for. More like what is suggested below by Christian.
- Mark as New
- Bookmark
- Subscribe
- Mute
- Subscribe to RSS Feed
- Get Direct Link
- Report Inappropriate Content
Re: Local data filter on different parts of the data
I noticed your x-axis is sorted LMS, when you probably want SML. You can change the order a column is plotted by the Valeu Order property:
https://www.youtube.com/watch?v=oKnSmX0JMik
https://www.jmp.com/support/help/en/18.1/index.shtml#page/jmp/value-order.shtml
Recommended Articles
- © 2026 JMP Statistical Discovery LLC. All Rights Reserved.
- Terms of Use
- Privacy Statement
- Contact Us


