- New to JMP? Join us Sept. 23-24 for the Early User Edition of Discovery Summit, tailor-made for new users. Register now for free!
- Your voice matters! Tell us how you prefer to receive JMP updates, so we can tailor our communication to your needs. Take short survey.
- See how to access JMP Marketplace - and - find, create & share add-ins to extend your JMP. Watch video.
- Subscribe to RSS Feed
- Mark Topic as New
- Mark Topic as Read
- Float this Topic for Current User
- Bookmark
- Subscribe
- Mute
- Printer Friendly Page
Discussions
Solve problems, and share tips and tricks with other JMP users.- JMP User Community
- :
- Discussions
- :
- Is having 6 terms in a linear regression with n = 8 acceptable?

- Mark as New
- Bookmark
- Subscribe
- Mute
- Subscribe to RSS Feed
- Get Direct Link
- Report Inappropriate Content
Is having 6 terms in a linear regression with n = 8 acceptable?
I am currently analyzing a full factorial experiment with 2 levels and 3 factors, unreplicated, n = 8. According to JMP guides, the proper methodology here would be to fit the model using factorial to degree 2, assuming higher order interactions are insignificant, before using backwards selection to reduce the model down to its significant factors.
JMP guide for 2x2x2 full factorial analysis: https://community.jmp.com/t5/Learning-Center/Analyzing-Full-Factorial-Experiments/ta-p/271995
My question is - suppose the data shows that in fact, all main effects and all 2-way interactions are significant. That leaves me with a model with 6 terms, describing a dataset with only 8 observations. At this point I have very high r^2 due to the high number of terms and p < 0.05 for all 6 factors. From an analytical point of view, is this considered overfitting, and would this be considered not best practice?
If so, would a better way to look at this data be to only look at main effects (i.e. looking at the "average" effect of each parameter rather than diving into details)?
Thanks.

- Mark as New
- Bookmark
- Subscribe
- Mute
- Subscribe to RSS Feed
- Get Direct Link
- Report Inappropriate Content
Re: Is having 6 terms in a linear regression with n = 8 acceptable?
@QW you are correct in that you should be careful about not overfitting a model, especially with a small data set. But, for a designed experiment, it may be the case that all of the two factor interactions are significant and/or important. If the planning and execution of the experiment was careful, then it could be that the experimental error is small relative to the effect sizes.
It is best to evaluate the data by:
- Plotting the data:
- A plot of all the data versus the factors (sometimes called factor plot or a main effects plot). Look for outliers, or other unusual data.
- Ask yourself if the data makes sense from a scientific/theory point of view
- Fit the model, and plot the residuals (errors in fit for each row).
- Residual by Predicted
- Residual by Row
- Residual be each factor
- Use the Profiler to explore the model's predicted effects
- It may be that a significant effect is really not practically important, and if so, you could remove it from the model with not much difference in the actual predictions.
If you have additional concerns about overfitting, you could try to apply Stepwise Regression model fitting to the data also,
- Mark as New
- Bookmark
- Subscribe
- Mute
- Subscribe to RSS Feed
- Get Direct Link
- Report Inappropriate Content
Re: Is having 6 terms in a linear regression with n = 8 acceptable?
Thanks for the response, Sam.
In the case of an unreplicated 2^3 factorial experiment, it's 'theoretically capable' of modeling all main effects and 2-factor interactions. But from this discussion it would seem that this capability is not that reliable in practice. Are there any 'rules of thumb' when it comes to how many degrees of freedom you want for modeling main effects and 2 factor interactions? For example, would it be something like DoF = 2x the number of model terms?

- Mark as New
- Bookmark
- Subscribe
- Mute
- Subscribe to RSS Feed
- Get Direct Link
- Report Inappropriate Content
Re: Is having 6 terms in a linear regression with n = 8 acceptable?
Welcome to the community. Here are my thoughts:
You are using the third order effect (3-factor interaction) to estimate the MSE. This is likely why all effects are significant. A better way to look at your data is to use Normal and half-normal plots (depending on how arbitrary the level setting is) and Pareto plots. Analyze>Fit Model>Saturate the model (all 7 DF's) using Macro>Full Factorial In the output, select the Red Triangle next to the response and select Effect Screening. Check the Pareto and Normal Plots. The normal plots will compare the effects to each other without the MSE bias. Add a value representing practical significance to the Pareto plot.
Once you have found the effects that are significant, you can remove the insignificant terms and re-run the fit model to get residual plots.
- Mark as New
- Bookmark
- Subscribe
- Mute
- Subscribe to RSS Feed
- Get Direct Link
- Report Inappropriate Content
Re: Is having 6 terms in a linear regression with n = 8 acceptable?
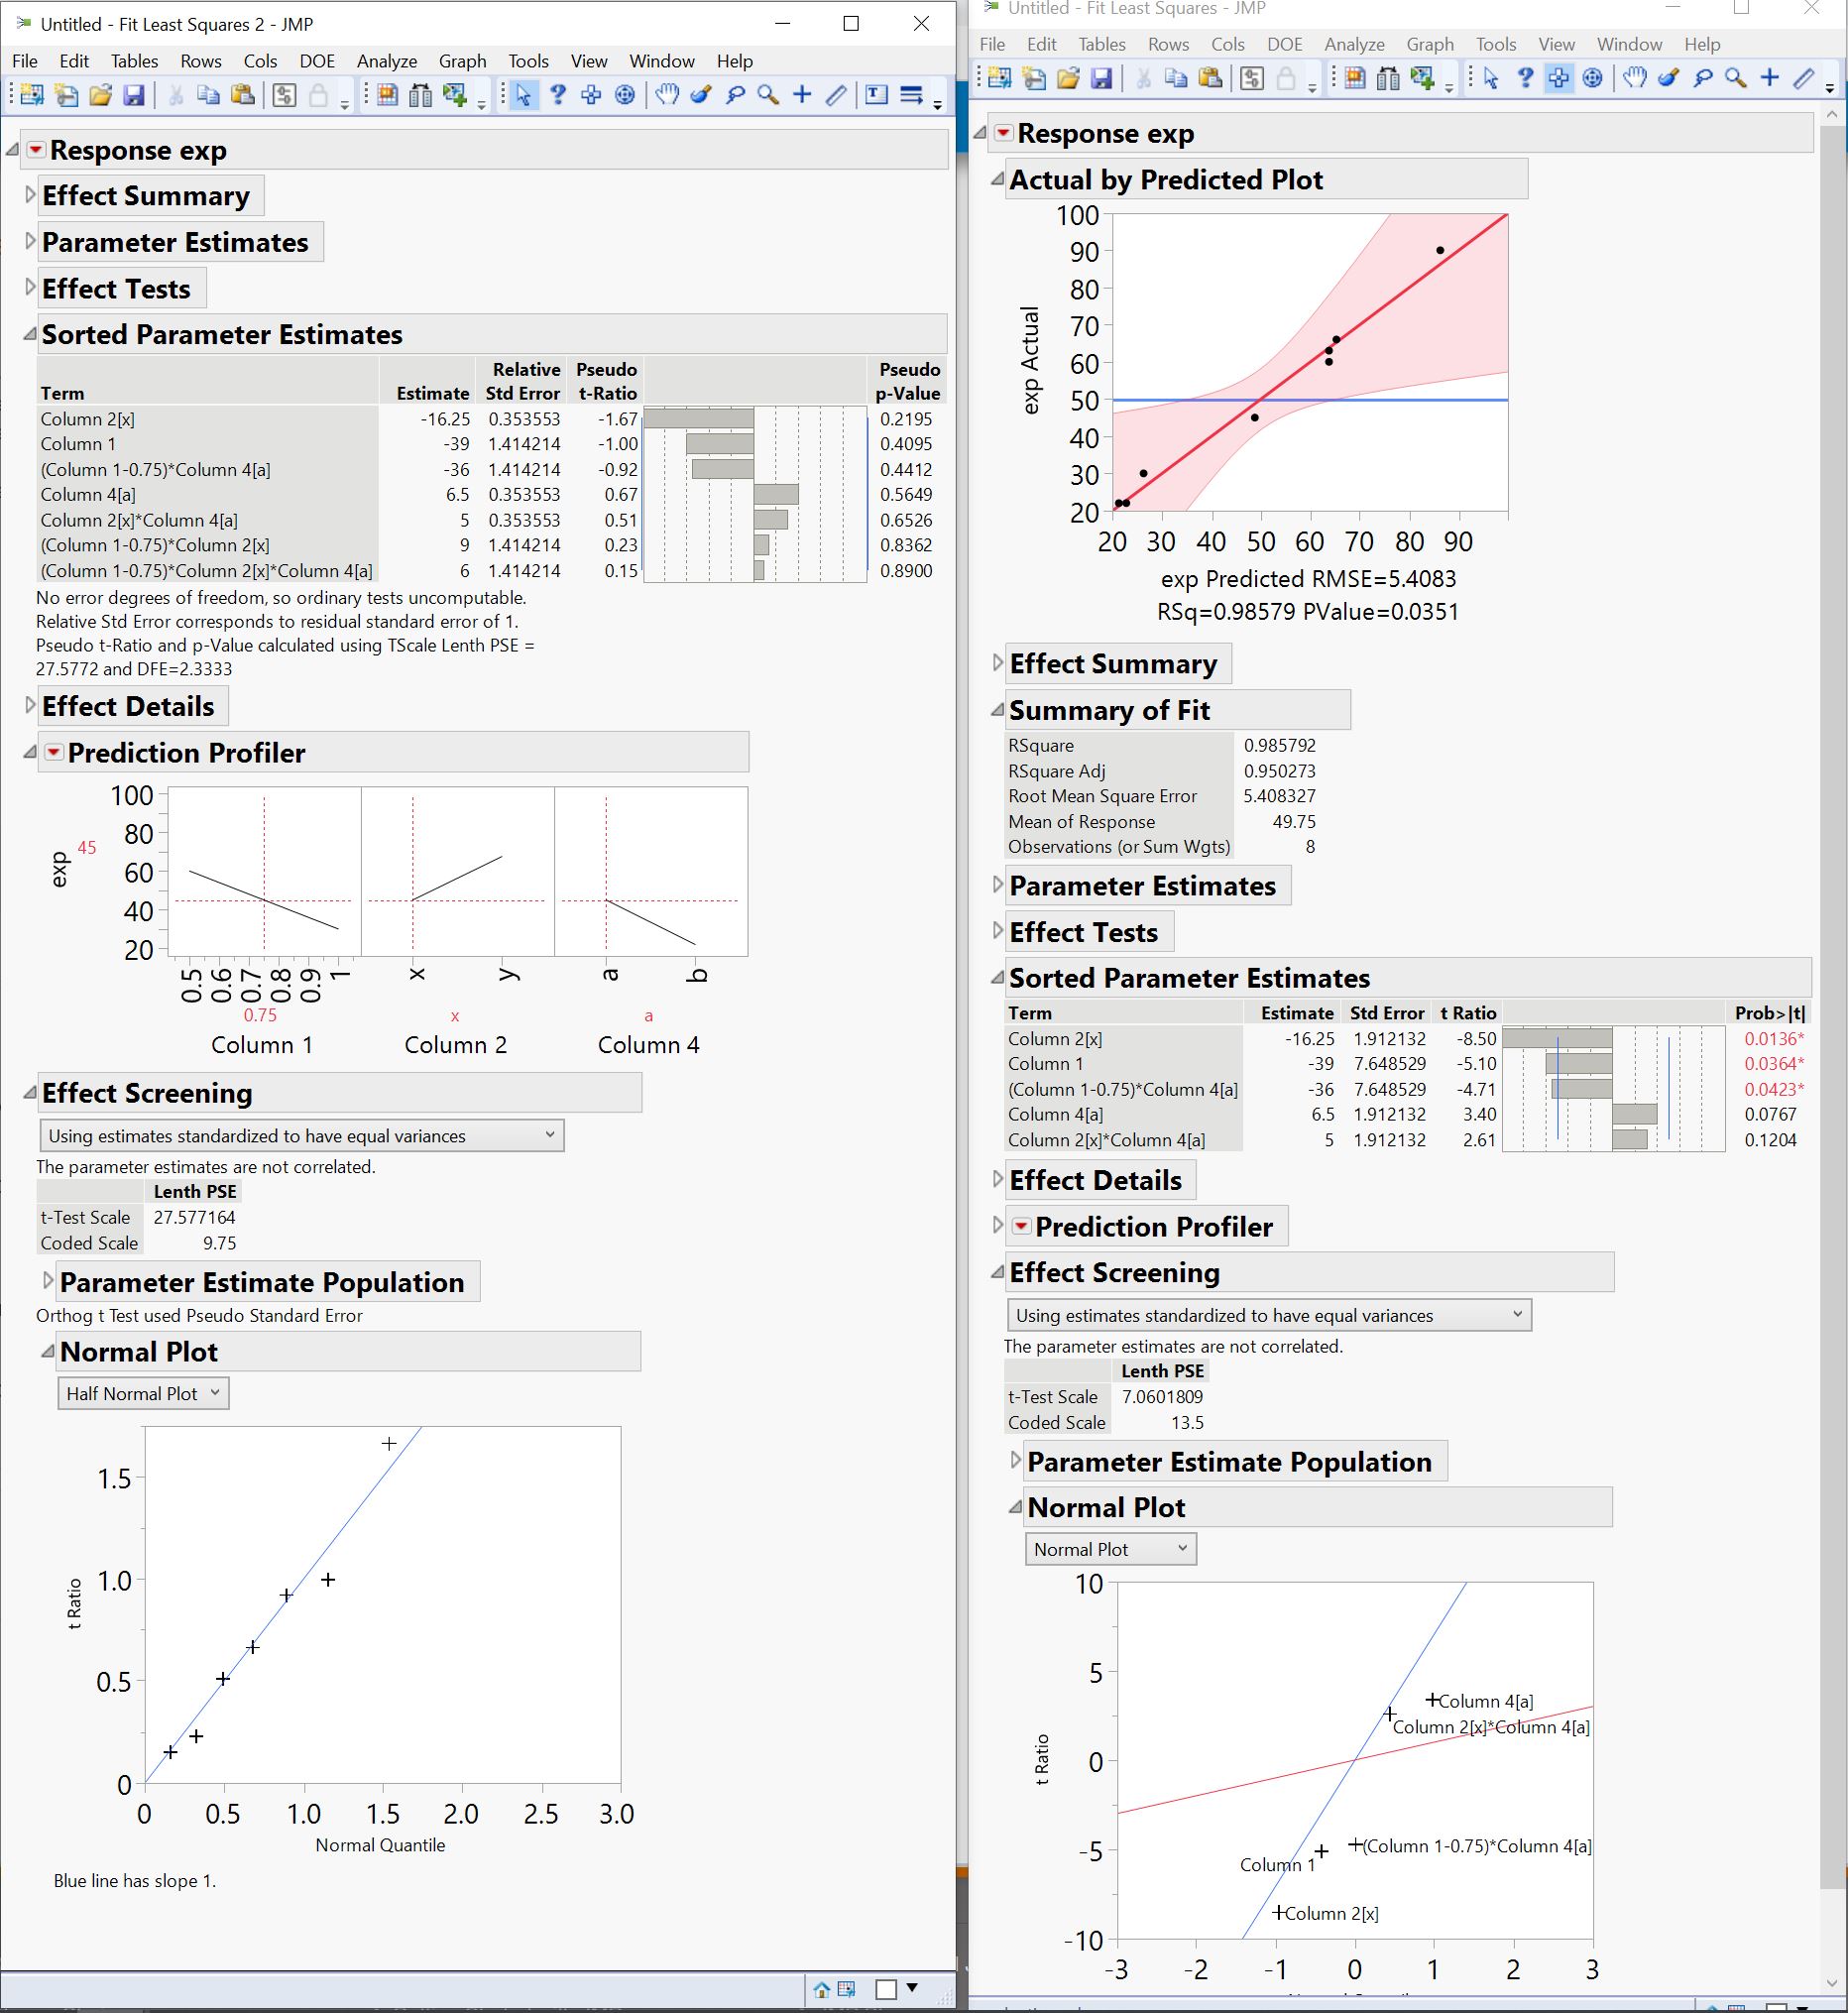
Thanks, @statman. I don't mean to continue on and on, and I thank you for your time. However, I tried using a normal plot to guide parameter selection from a saturated model. However, once I did that, I noticed that according to both the normal plot and Lenth's pseudo p-values, none of my parameters are significant (left side of my attachment). But once I started removing nonsignificant terms one at a time using those (pseudo or real) p-values, I arrived at a model that seems to describe my situation well: adjusted R^2 = 0.95, p = 0.0351 (right side of the attachment). Would it be correct to conclude that a combination of both pseudo/real p-values and normal plots is needed to arrive at the best model?
On that train of thought, would you then agree that the best way to select the parameters involves both quantitative (p-values, adj.R^2) and qualitative approaches (domain knowledge, normal plots, residuals)? In other words, it's a combination of:
1. What do my factors look like with a normal/Pareto plot?
2. Does adding/removing terms improve quantitative values (adj. R^2, p-value of the whole model)?
3. Does it change the qualitative aspects of the data (do the residuals still stay normally distributed after these changes, and does the data itself make sense realistically)?
In that case, the best model would be first guided by looking at Normal/Pareto plots, fine-tuned by stepwise/model selection, and verified by visual inspection of residuals and real data.
Thank you!
- Mark as New
- Bookmark
- Subscribe
- Mute
- Subscribe to RSS Feed
- Get Direct Link
- Report Inappropriate Content
Re: Is having 6 terms in a linear regression with n = 8 acceptable?
QW, here are my thoughts:
1. The reason why you find significant factors after removing the insignificant terms is because you have biased the MSE. When you remove the insignificant term (which likely has smaller SS) you also take the DF's with each term. Since the MSE is the SS/DF, you reduce the MSE (perhaps unrealistically). The F-value is the MSfactor/MSerror. So if you unrealistically reduce the MSE, you inflate the F-value and subsequently lower the p-value. My word of advise is to ALWAYS consider what sources of variation are you comparing.
2. Normal/ Half Normal plots (Daniel Plots) are not necessarily straight forward on how to interpret. Russel's PSE is an attempt to help interpret the charts, but the PSE is not always useful. You have to consider which effects are a function of the random errors (should be a relatively straight line) and which effects are assignable. Fall outside the random distribution of errors. If your Normal plot has an S-curve shape or is broken, this is an indication of a significant noise effect (there may be more than one distribution of random errors). From your picture, it looks like the greyed out + at the top of the normal plot is significant (my guess is this is Column2(x)). It really helps to have the Pareto Plot with the normal plot. Assess both statistical signals and practical significance.
3. I think you have a good start to how to build your knowledge (and perhaps a mathematical model). I use the Practical>Graphical>Quantitative method:
First, how much variation in the data did you create in the experiment? Is the data of any practical value (from the SME perspective)? How does the data compared with what you predicted? How would it compare to your hypotheses used to determine which factors to include in the study? ANOG and MR charts are excellent for recognizing patterns correlating factor effects with the response variables. Never turn off engineering.
Second, graph/plot the data. JMP's graph builder can be very useful. Are there any unusual data points (treatments)? This is also where Normal Plots and Pareto plots are useful (though their usefulness is best with saturated models).
Lastly quantitative (effects, ANOVA, regression, et. al.).
4. Regarding model refinement with quantitative methods for DOE data: There are a number of statistics/plots we use to do this:
- R-square-R-square Adjusted delta (This is more important than either statistic on its own)
- RMSE (smaller is better)
- p-values (be careful of biased values, consider what is being compared)
- Residuals (to test NID(mean, variance) assumptions
In DOE, I don't recommend step-wise regression (this is an additive model building approach most useful for data mining or regressing on observational/historical data and of course you have an additional concern of collinearity). I recommend a subtractive approach (start saturated and remove terms). And your step 3 sounds great!
- Mark as New
- Bookmark
- Subscribe
- Mute
- Subscribe to RSS Feed
- Get Direct Link
- Report Inappropriate Content
Re: Is having 6 terms in a linear regression with n = 8 acceptable?
Thanks, @statman. This is all very helpful. I ultimately looked at the data and realized that in a designed experiment, if I were to graphically look at the data, I would have come to the same conclusions that the model is telling me re. the interactions and what factors are significant. As such, I call it good.
Recommended Articles
- © 2026 JMP Statistical Discovery LLC. All Rights Reserved.
- Terms of Use
- Privacy Statement
- Contact Us