- Subscribe to RSS Feed
- Mark Topic as New
- Mark Topic as Read
- Float this Topic for Current User
- Bookmark
- Subscribe
- Mute
- Printer Friendly Page
Discussions
Solve problems, and share tips and tricks with other JMP users.- JMP User Community
- :
- Discussions
- :
- Interaction Profiles - automated display of panels based on factor inclusion
- Mark as New
- Bookmark
- Subscribe
- Mute
- Subscribe to RSS Feed
- Get Direct Link
- Report Inappropriate Content
Interaction Profiles - automated display of panels based on factor inclusion
My question is how JMP controls the display of panels of Interaction Profiles plots that correspond to factors not included in the associated model.
Does JMP consistently display such panels differently from panels corresponding to factors that are included?
I would like to distinguish factors included and omitted (within the model) on JMP Interaction Profiles. In my experience this operation is done automatically in some cases but not others.
In the first screenshot(1-No_distinction) I've manually indicated the terms included in the model with asterisks (*).
JMP did not distinguish the display of the panels based on inclusion of factors.
In a different JMP workbook the plots corresponding to factors not included in the model are dashed lines and appear with dimmed intensity (2-With_distinction).
- Tags:
- windows
- Mark as New
- Bookmark
- Subscribe
- Mute
- Subscribe to RSS Feed
- Get Direct Link
- Report Inappropriate Content
Re: Interaction Profiles - automated display of panels based on factor inclusion
I believe to have uncovered the source of the inconsistency. I have reproducibly generated the following outcomes:
Outcome 1: Gray-out display properties as desired:
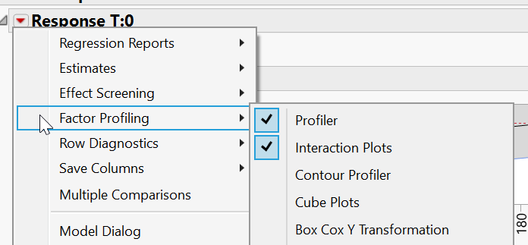
Interaction Profiles must be “requested” in the JMP dialog via the drop-down for the Response as shown in the screenshot cursor:
--------------
Outcome 2: Gray-out display properties are not implemented, leading to inconsistency with respect to the terms included in the model:
Interaction Profiles are “requested” in the JMP dialog via the drop-down for the Prediction Profiler, a sub-item of the Response.
In the screenshot for Outcome 2, it the AC AD AE plots are not grayed out.
In fact, both modes of Interaction Profile panels can be displayed simultaneously.
In summary to have the gray-out/dashed line display consistently dependent on the inclusion of respective interaction terms in the model the Interaction Profile panel apparently must be activated from the Factor Profiling menu for the Response.
- « Previous
-
- 1
- 2
- Next »
Recommended Articles
- © 2025 JMP Statistical Discovery LLC. All Rights Reserved.
- Terms of Use
- Privacy Statement
- Contact Us


