- Subscribe to RSS Feed
- Mark Topic as New
- Mark Topic as Read
- Float this Topic for Current User
- Bookmark
- Subscribe
- Mute
- Printer Friendly Page
Discussions
Solve problems, and share tips and tricks with other JMP users.- JMP User Community
- :
- Discussions
- :
- Incorrect 95% confidence interval range for matched pairs plot?
- Mark as New
- Bookmark
- Subscribe
- Mute
- Subscribe to RSS Feed
- Get Direct Link
- Report Inappropriate Content
Incorrect 95% confidence interval range for matched pairs plot?
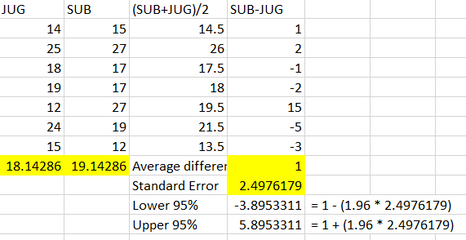
I am trying to create a bland-altman plot using the matched pairs function in JMP. I created the plot below and decided to double-check some of the statistics calculated on excel. I found that while the standard error and mean difference were correct, my upper and lower 95% confidence interval values were very different than the ones provided by JMP Pro 16
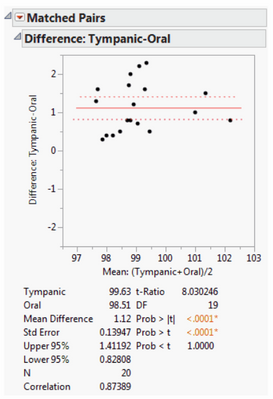
I tried to test out their match pair example (found here: https://www.jmp.com/support/help/en/16.0/?os=win&source=application&utm_source=helpmenu&utm_medium=a...) and got similar values when I calculated the 95% confidence interval range, which tells me my manual calculations are correct.

I'm wondering if there is an error in the matched pairs report for the plot I created or if I'm misunderstanding confidence interval calculations. Any thoughts and suggestions would be appreciated! Thanks!
Accepted Solutions
- Mark as New
- Bookmark
- Subscribe
- Mute
- Subscribe to RSS Feed
- Get Direct Link
- Report Inappropriate Content
Re: Incorrect 95% confidence interval range for matched pairs plot?
Hi,
In your calculation of the confidence interval you use 1.96. This would be approximately correct for a large sample size. However, for smaller samples sizes the confidence interval should be calculated using the value from the t-distribution corresponding to the number of degrees of freedom. This will give wider confidence intervals.
For example, for n = 7 (6 degrees of freedom) and alpha = 0.05, the t value is 2.4469. The Excel function to calculate this is =T.INV.2T(0.05,6). If you use that in place in 1.96, you should find you get the confidence interval you were given by JMP.
This article from the Statistics Knowledge Portal and this white paper might be useful resources for you.
I hope that helps.
Phil
- Mark as New
- Bookmark
- Subscribe
- Mute
- Subscribe to RSS Feed
- Get Direct Link
- Report Inappropriate Content
Re: Incorrect 95% confidence interval range for matched pairs plot?
- Mark as New
- Bookmark
- Subscribe
- Mute
- Subscribe to RSS Feed
- Get Direct Link
- Report Inappropriate Content
Re: Incorrect 95% confidence interval range for matched pairs plot?
Hi,
In your calculation of the confidence interval you use 1.96. This would be approximately correct for a large sample size. However, for smaller samples sizes the confidence interval should be calculated using the value from the t-distribution corresponding to the number of degrees of freedom. This will give wider confidence intervals.
For example, for n = 7 (6 degrees of freedom) and alpha = 0.05, the t value is 2.4469. The Excel function to calculate this is =T.INV.2T(0.05,6). If you use that in place in 1.96, you should find you get the confidence interval you were given by JMP.
This article from the Statistics Knowledge Portal and this white paper might be useful resources for you.
I hope that helps.
Phil
- Mark as New
- Bookmark
- Subscribe
- Mute
- Subscribe to RSS Feed
- Get Direct Link
- Report Inappropriate Content
Re: Incorrect 95% confidence interval range for matched pairs plot?
Recommended Articles
- © 2026 JMP Statistical Discovery LLC. All Rights Reserved.
- Terms of Use
- Privacy Statement
- Contact Us


