- Subscribe to RSS Feed
- Mark Topic as New
- Mark Topic as Read
- Float this Topic for Current User
- Bookmark
- Subscribe
- Mute
- Printer Friendly Page
Discussions
Solve problems, and share tips and tricks with other JMP users.- JMP User Community
- :
- Discussions
- :
- Re: How to plot line graph?
- Mark as New
- Bookmark
- Subscribe
- Mute
- Subscribe to RSS Feed
- Get Direct Link
- Report Inappropriate Content
How to plot line graph?
- Tags:
- windows
Accepted Solutions
- Mark as New
- Bookmark
- Subscribe
- Mute
- Subscribe to RSS Feed
- Get Direct Link
- Report Inappropriate Content
Re: How to plot line graph?
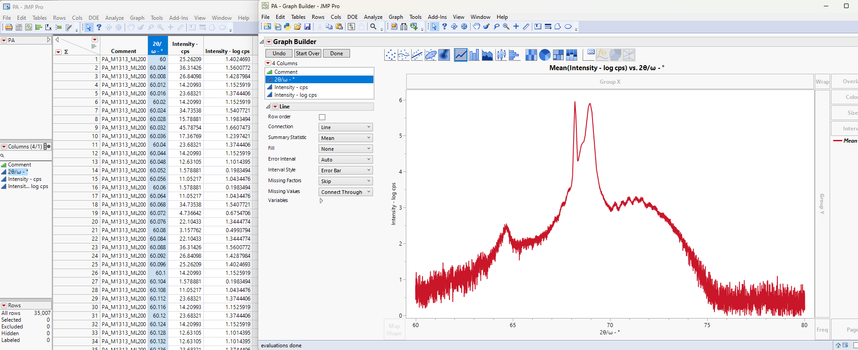
Attached is what I think you want. You should have saved the script for the graph you built so we could see exactly what you did. But the obvious thing to notice was that your file showed the data as nominal variables. I used Standardize Attributes to change these to numerical and continuous to get the correct graph (which is stored as a script in the file).
- Mark as New
- Bookmark
- Subscribe
- Mute
- Subscribe to RSS Feed
- Get Direct Link
- Report Inappropriate Content
Re: How to plot line graph?
You have your data types and modeling types incorrect in your data table. Change all of your columns except your Comment column to Numeric, Continuous, and then plot the data any you will get what you want
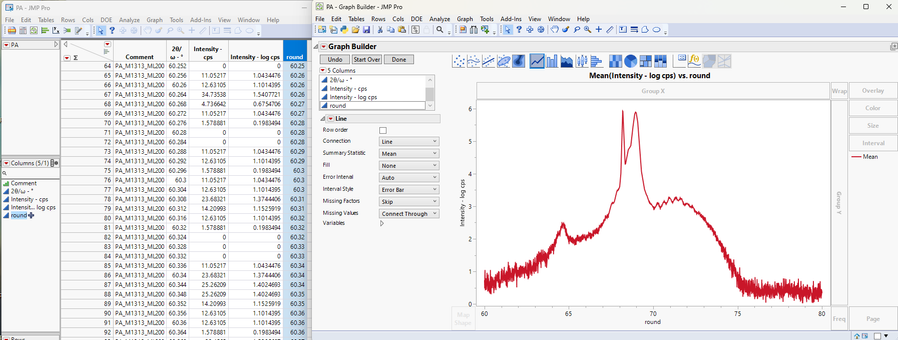
I played around with the precision of the X axis, rounding it off to 2 decimal places, and ended up with a graph that is closer to your target graph.
- Mark as New
- Bookmark
- Subscribe
- Mute
- Subscribe to RSS Feed
- Get Direct Link
- Report Inappropriate Content
Re: How to plot line graph?
Without being able to see the actual data, my guess is that in Figure 1, the line is drawn using some sort of smoother, where in your Graph Builder output the line is drawn between each actual data point.
It would be very helpful if you could provide more details. A sample data table would be best.
- Mark as New
- Bookmark
- Subscribe
- Mute
- Subscribe to RSS Feed
- Get Direct Link
- Report Inappropriate Content
Re: How to plot line graph?
I have attached the jmp file.
- Mark as New
- Bookmark
- Subscribe
- Mute
- Subscribe to RSS Feed
- Get Direct Link
- Report Inappropriate Content
Re: How to plot line graph?
Attached is what I think you want. You should have saved the script for the graph you built so we could see exactly what you did. But the obvious thing to notice was that your file showed the data as nominal variables. I used Standardize Attributes to change these to numerical and continuous to get the correct graph (which is stored as a script in the file).
- Mark as New
- Bookmark
- Subscribe
- Mute
- Subscribe to RSS Feed
- Get Direct Link
- Report Inappropriate Content
Re: How to plot line graph?
You have your data types and modeling types incorrect in your data table. Change all of your columns except your Comment column to Numeric, Continuous, and then plot the data any you will get what you want
I played around with the precision of the X axis, rounding it off to 2 decimal places, and ended up with a graph that is closer to your target graph.
Recommended Articles
- © 2026 JMP Statistical Discovery LLC. All Rights Reserved.
- Terms of Use
- Privacy Statement
- Contact Us


