This website uses Cookies. Click Accept to agree to our website's cookie use as described in our Privacy Policy. Click Preferences to customize your cookie settings.
- JMP User Community
- :
- Discussions
- :
- How to create multiple reports in single layout
Turn on suggestions
Auto-suggest helps you quickly narrow down your search results by suggesting possible matches as you type.
Submit your abstract to the call for content for Discovery Summit Americas by April 23. Selected abstracts will be presented at Discovery Summit, Oct. 21- 24.
Discovery is online this week, April 16 and 18. Join us for these exciting interactive sessions.
Topic Options
- Subscribe to RSS Feed
- Mark Topic as New
- Mark Topic as Read
- Float this Topic for Current User
- Bookmark
- Subscribe
- Printer Friendly Page

Level I
- Mark as New
- Bookmark
- Subscribe
- Mute
- Subscribe to RSS Feed
- Get Direct Link
- Report Inappropriate Content
How to create multiple reports in single layout
Jan 10, 2014 01:18 AM
(13099 views)
How to create multiple reports in single layout
I have performed multiple analysis using different platforms, how can i combine the same in a single window for presentation and automate the same. Any help in this regards is appreciated
1 ACCEPTED SOLUTION
Accepted Solutions

Staff
Solution
- Mark as New
- Bookmark
- Subscribe
- Mute
- Subscribe to RSS Feed
- Get Direct Link
- Report Inappropriate Content
Re: How to create multiple reports in single layout
Created:
Jan 10, 2014 10:31 AM
| Last Modified: Oct 18, 2016 04:31 PM
(16203 views)
| Posted in reply to message from sk1234 01-10-2014
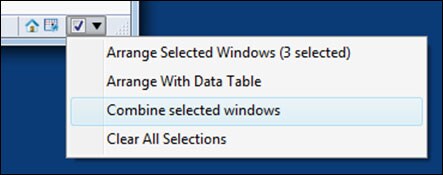
On Windows, you can select the reports using the toggle in the bottom-right corner, and then use "Combine selected windows":

With JMP 10, this will work for reports from a single data table arranged horizontally or vertically. Starting with JMP 11, additional features include:
1) Support for Mac from the "Window > Combine Windows" menu.
2) Windows can be in any layout
3) Data Tables can be included as well as reports
4) Multiple data tables and their dependent reports are supported
Once the windows are combined, there will be a new red-triangle menu for the "Report" Outline that provides several options for reproducing the combined report:

You can save the report to a Data Table if you only need to reproduce the report using the same table. If you want to automate the process for another table, you can create an Add-In. This will create a menu item that you can invoke against any data table. The name of the menu item can be specified when saving the Add-In.
As described, this approach works when the analysis will always be done on the same columns. There are additional steps that you could take to further customize the layout and workflow of the application through the "Edit Application" menu item above.
Hope that helps!
-Dan
3 REPLIES 3

Staff (Retired)
- Mark as New
- Bookmark
- Subscribe
- Mute
- Subscribe to RSS Feed
- Get Direct Link
- Report Inappropriate Content
Re: How to create multiple reports in single layout
Tips and Tricks
Combining Windows in JMP® 10 (Windows only)
Did you know that starting in JMP 10, you can easily combine multiple reports associated with a data table into a single report window without writing a JMP script? Suppose you have produced multiple analyses and graphs, and would like to display the results in one window. If you put the reports in a JMP journal, you lose the interactivity between the reports and the data table. To maintain this interactivity, use the new combining feature.
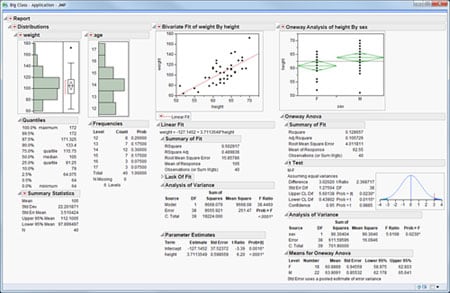
First, open Big Class.jmp from the Sample Data folder. Click the red triangles next toDistribution, Bivariate and Oneway in the Table panel, and select Run Script for each to produce three reports. Arrange the reports on your desktop as you would like them to be arranged in the combined window; both simple horizontal or vertical layouts are supported.
Check the box in the lower-right corner of each report.
 |
Click the downward pointing triangle next to the check box in any of the windows and selectCombine selected windows.
 |
The three reports are combined in a single report window that is still linked to the data table!
 |
Clicking the red triangle next to Report displays a menu with several options.
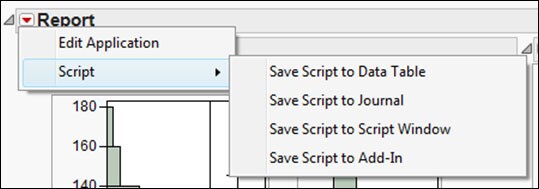 |
In the script submenu, there are familiar commands for saving a script to recreate the report. The Edit Application command opens the report in the Application Builder, which is also new in JMP 10, for further editing or customization.
Note: You can also combine selected windows from the Window -> Arrange submenu, or by selecting the reports in the JMP Home window, right-clicking on them, and selectingCombine.
You can learn more about this topic in our course Application Development Using the JMP Scripting Language.
This tip was provided by Monica Beals, JMP instructor.
Staff
Solution
- Mark as New
- Bookmark
- Subscribe
- Mute
- Subscribe to RSS Feed
- Get Direct Link
- Report Inappropriate Content
Re: How to create multiple reports in single layout
Created:
Jan 10, 2014 10:31 AM
| Last Modified: Oct 18, 2016 04:31 PM
(16204 views)
| Posted in reply to message from sk1234 01-10-2014
On Windows, you can select the reports using the toggle in the bottom-right corner, and then use "Combine selected windows":
With JMP 10, this will work for reports from a single data table arranged horizontally or vertically. Starting with JMP 11, additional features include:
1) Support for Mac from the "Window > Combine Windows" menu.
2) Windows can be in any layout
3) Data Tables can be included as well as reports
4) Multiple data tables and their dependent reports are supported
Once the windows are combined, there will be a new red-triangle menu for the "Report" Outline that provides several options for reproducing the combined report:
You can save the report to a Data Table if you only need to reproduce the report using the same table. If you want to automate the process for another table, you can create an Add-In. This will create a menu item that you can invoke against any data table. The name of the menu item can be specified when saving the Add-In.
As described, this approach works when the analysis will always be done on the same columns. There are additional steps that you could take to further customize the layout and workflow of the application through the "Edit Application" menu item above.
Hope that helps!
-Dan
Level I
- Mark as New
- Bookmark
- Subscribe
- Mute
- Subscribe to RSS Feed
- Get Direct Link
- Report Inappropriate Content
Re: How to create multiple reports in single layout
Thanks Dan and LouV the tip was of great help.
- © 2024 JMP Statistical Discovery LLC. All Rights Reserved.
- Terms of Use
- Privacy Statement
- About JMP
- JMP Software
- JMP User Community
- Contact