- JMP will suspend normal business operations for our Winter Holiday beginning on Wednesday, Dec. 24, 2025, at 5:00 p.m. ET (2:00 p.m. ET for JMP Accounts Receivable).
Regular business hours will resume at 9:00 a.m. EST on Friday, Jan. 2, 2026. - We’re retiring the File Exchange at the end of this year. The JMP Marketplace is now your destination for add-ins and extensions.
- Subscribe to RSS Feed
- Mark Topic as New
- Mark Topic as Read
- Float this Topic for Current User
- Bookmark
- Subscribe
- Mute
- Printer Friendly Page
Discussions
Solve problems, and share tips and tricks with other JMP users.- JMP User Community
- :
- Discussions
- :
- Re: How to connect markers with lines in this plot?
- Mark as New
- Bookmark
- Subscribe
- Mute
- Subscribe to RSS Feed
- Get Direct Link
- Report Inappropriate Content
How to connect markers with lines in this plot?
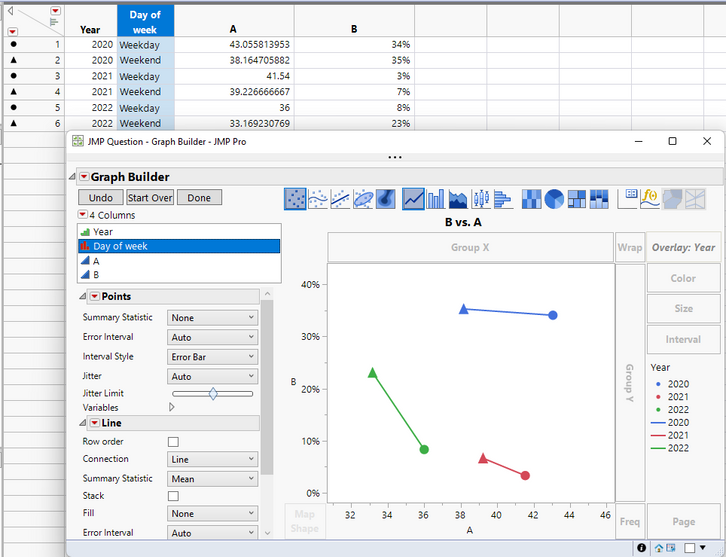
I've made the attached plot and want to connect the markers for each year with a line. The dataset is also attached. Any advice is appreciated.
Accepted Solutions
- Mark as New
- Bookmark
- Subscribe
- Mute
- Subscribe to RSS Feed
- Get Direct Link
- Report Inappropriate Content
Re: How to connect markers with lines in this plot?
There are likely a few ways to accomplish this. I manually created different markers for Weekday and Weekend days, then I used Year in the Overlay zone, and added a line feature. Updated data table attached.
- Mark as New
- Bookmark
- Subscribe
- Mute
- Subscribe to RSS Feed
- Get Direct Link
- Report Inappropriate Content
Re: How to connect markers with lines in this plot?
@Jed_Campbell This is interesting approach! Thanks.
- Mark as New
- Bookmark
- Subscribe
- Mute
- Subscribe to RSS Feed
- Get Direct Link
- Report Inappropriate Content
Re: How to connect markers with lines in this plot?
Hello,
One relatively easy way to do this is to use X and Y as you have, use DayOfWeek as a graph marker by right-clicking on this column in the left pane of the data table and selecting "use as marker", using Year in the Overlay role, and using both the "Line" and "Points" elements in the graph.
This has the ancillary benefit of not requiring the analyst to remember which of the symbols correspond to "weekday" and which correspond to "weekend".
Cheers,
Brady
Recommended Articles
- © 2025 JMP Statistical Discovery LLC. All Rights Reserved.
- Terms of Use
- Privacy Statement
- Contact Us


