- New to JMP? Join us Sept. 23-24 for the Early User Edition of Discovery Summit, tailor-made for new users. Register now for free!
- Your voice matters! Tell us how you prefer to receive JMP updates, so we can tailor our communication to your needs. Take short survey.
- See how to access JMP Marketplace - and - find, create & share add-ins to extend your JMP. Watch video.
- Subscribe to RSS Feed
- Mark Topic as New
- Mark Topic as Read
- Float this Topic for Current User
- Bookmark
- Subscribe
- Mute
- Printer Friendly Page
Discussions
Solve problems, and share tips and tricks with other JMP users.- JMP User Community
- :
- Discussions
- :
- Re: How to compare Group Differences with small sample sizes ?

- Mark as New
- Bookmark
- Subscribe
- Mute
- Subscribe to RSS Feed
- Get Direct Link
- Report Inappropriate Content
How to compare Group Differences with small sample sizes ?
Hello everyone,
I have 3 different groups and I'm aiming to compare them to see if there are any statistically significant differences. However, my sample sizes are quite small: Group 1 has 3 samples, Group 2 has 2 samples, and Group 3 has 3 samples. Due to this small sample size, I'm unable to test for normality.
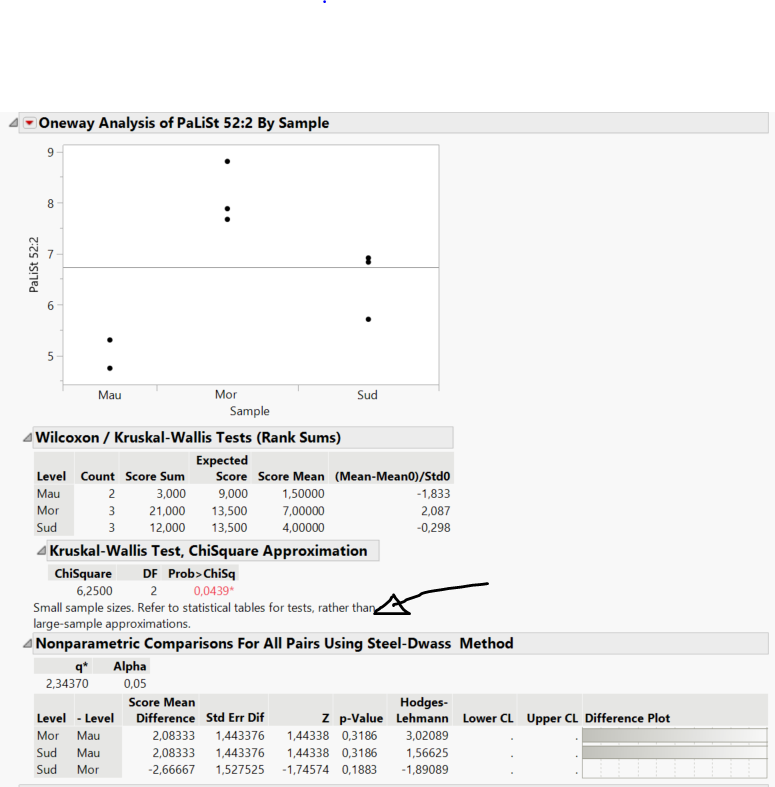
To analyze the data, I conducted a Kruskal-Wallis test followed by a Steel-Dwass test (as a post-hoc analysis). I've attached a screenshot of the output for one of the variables, but I have similar results for other variables as well.
Now, I have a few questions regarding the results:
The footnote below the Kruskal-Wallis table mentions "small sample sizes" and suggests referring to statistical tables for tests rather than relying on large-sample approximations. Could someone please clarify what this means, and what to do in that case?
I noticed that the Kruskal-Wallis test reported significant differences in variance, while the Steel-Dwass test reported no differences at all. Is this a common outcome that a post-hoc test reports different results?
Lastly, I would appreciate any suggestions for alternative tests or approaches to assess significant differences between the three groups. Initially, I didn't conduct any tests due to the small sample size, but a reviewer of my article requested that I implement a test to assess differences.
Thank you for your help!

- Mark as New
- Bookmark
- Subscribe
- Mute
- Subscribe to RSS Feed
- Get Direct Link
- Report Inappropriate Content
Re: How to compare Group Differences with small sample sizes ?
Honestly, I don't see what a statistical test could add to the graph. Perhaps someone with a better statistical background can articulate a reason, but I wouldn't care whether the p value was 0.03 or 0.1 or 0.4 in this case. The graph suggests that the middle group is highest with a bit weaker "evidence" that the third group is higher than the first. It is a good start and I would view it as an exploratory analysis - so no p value is needed. I don't think the p value adds anything to what the graph is showing. You need a larger sample size, and these results suggest it is worth pursuing that, and if it is possible designing an appropriate experiment based on what you are seeing from these preliminary results.

- Mark as New
- Bookmark
- Subscribe
- Mute
- Subscribe to RSS Feed
- Get Direct Link
- Report Inappropriate Content
Re: How to compare Group Differences with small sample sizes ?
You are probably ok to use a traditional ANOVA analysis in this situation. The non-parametric tests don't address small samples sizes, they just assume a different underlying statistical model (or make less assumptions about the underlying statistical model.
To determine the p-value for a statistical test requires knowing the expected distribution of that test statistic when the null hypothesis is true. For larger sample sizes, those distributions can be approximated by well know distributions, but for smaller samples sizes, it typically requires an enumeration or statistical simulation to determine the percentile of the distribution. There are many places you can find the small sample size critical values for the Wilcoxon / Kruskal-Wallace test, for instance https://onlinepubs.trb.org/onlinepubs/nchrp/cd-22/manual/v2appendixc.pdf (see table C-7).
The Steel-Dwass multiple comparisons test is also non-parametric, and because it is controlling the overall type I error rate, it is hard to show statistical significance for each pair. In your case, the sample sizes may not allow calculating confidence intervals.
- Mark as New
- Bookmark
- Subscribe
- Mute
- Subscribe to RSS Feed
- Get Direct Link
- Report Inappropriate Content
Re: How to compare Group Differences with small sample sizes ?
Hi @SamGardner
If get you well, since my sample sizes are small it is not possible to calculate confidence intervals; thus I can not use the non-parametric test is this correct?
But I can not use ANOVA as well because I can not test normality due to the sample size again
SO what to do in that case?
- Mark as New
- Bookmark
- Subscribe
- Mute
- Subscribe to RSS Feed
- Get Direct Link
- Report Inappropriate Content
Re: How to compare Group Differences with small sample sizes ?
You can still do the ANOVA, save the residuals from the ANOVA (it will save them to a column named "<Response> Centered by <Group>"model and make a histogram, QQ plot, ... This is me speaking as a statistician...don't make so much of normality. It will be ok. The only reason it might not if is you have a very large outlier or you knew that the the process that produces the results will have a response distribution that is markedly non-normal. ANOVA is fairly robust to small to moderate departures from normality.

- Mark as New
- Bookmark
- Subscribe
- Mute
- Subscribe to RSS Feed
- Get Direct Link
- Report Inappropriate Content
Re: How to compare Group Differences with small sample sizes ?
@SamGardner I see you did a normality test by combining all the data points so you ended up with 9 data points, I thought you were supposed to do the test for each group

- Mark as New
- Bookmark
- Subscribe
- Mute
- Subscribe to RSS Feed
- Get Direct Link
- Report Inappropriate Content
Re: How to compare Group Differences with small sample sizes ?
Hi @ELH The residuals should be normally distributed (residuals are the data “corrected”, via subtracting group mean, for differences between groups so you can assess normality of residuals wrt to all observations). But as @SamGardner said, a small departure from normality is nothing to worry about. Constant variance is, IMHO, more important than normality; informally, this means the spread of data within each group should be about the same for each group. So, in general, if your residual plot (residuals vs. predicted) looks random with no pattern to speak of, then keep calm and carry on.
Recommended Articles
- © 2026 JMP Statistical Discovery LLC. All Rights Reserved.
- Terms of Use
- Privacy Statement
- Contact Us