- Subscribe to RSS Feed
- Mark Topic as New
- Mark Topic as Read
- Float this Topic for Current User
- Bookmark
- Subscribe
- Mute
- Printer Friendly Page
Discussions
Solve problems, and share tips and tricks with other JMP users.- JMP User Community
- :
- Discussions
- :
- Re: How to add an average line to a bar plot
- Mark as New
- Bookmark
- Subscribe
- Mute
- Subscribe to RSS Feed
- Get Direct Link
- Report Inappropriate Content
How to add an average line to a bar plot
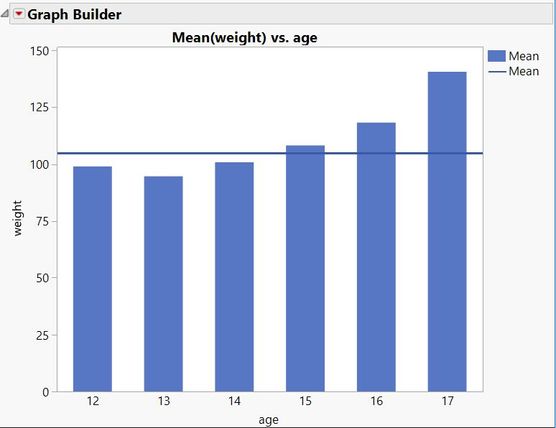
I am trying to add an average line to a bar plot and create a plot similar to the following picture:
So far I can only plot the bars and when I am adding an extra column for average values to add to the plot, they will be plotted as an extra bar plot next to the original and I don't know how to change the format for this specific data set. Any help is appreciated.
Accepted Solutions
- Mark as New
- Bookmark
- Subscribe
- Mute
- Subscribe to RSS Feed
- Get Direct Link
- Report Inappropriate Content
Re: How to add an average line to a bar plot
Mark, not surprisingly, beat me to it. But since I had a response ready, here is another approach:
Graph > Graph Builder.
Drag response to Y zone.
Drag category variable to X zone.
Select the bar element.
Hold the shift key and select the Line element.
In the Line properties, click the Variables gray triangle and remove the checkbox for the X category variable.
- Mark as New
- Bookmark
- Subscribe
- Mute
- Subscribe to RSS Feed
- Get Direct Link
- Report Inappropriate Content
Re: How to add an average line to a bar plot
Do you want something like this?
- Select Graph > Graph Builder.
- Drag response to Y drop zone.
- Drag category to X drop zone.
- Select the Bar element.
- Right-click on response data column in list and select Aggregate > Mean.
- Drag new Mean response column to frame just inside Y scale.
- Right-click Y scale and select Move Right > Mean.
- Right-click a bar and select Bar-right > Change to > Line.
- Mark as New
- Bookmark
- Subscribe
- Mute
- Subscribe to RSS Feed
- Get Direct Link
- Report Inappropriate Content
Re: How to add an average line to a bar plot
Mark, not surprisingly, beat me to it. But since I had a response ready, here is another approach:
Graph > Graph Builder.
Drag response to Y zone.
Drag category variable to X zone.
Select the bar element.
Hold the shift key and select the Line element.
In the Line properties, click the Variables gray triangle and remove the checkbox for the X category variable.
Recommended Articles
- © 2026 JMP Statistical Discovery LLC. All Rights Reserved.
- Terms of Use
- Privacy Statement
- Contact Us


