- New to JMP? Join us Sept. 23-24 for the Early User Edition of Discovery Summit, tailor-made for new users. Register now for free!
- Your voice matters! Tell us how you prefer to receive JMP updates, so we can tailor our communication to your needs. Take short survey.
- See how to access JMP Marketplace - and - find, create & share add-ins to extend your JMP. Watch video.
- Subscribe to RSS Feed
- Mark Topic as New
- Mark Topic as Read
- Float this Topic for Current User
- Bookmark
- Subscribe
- Mute
- Printer Friendly Page
Discussions
Solve problems, and share tips and tricks with other JMP users.- JMP User Community
- :
- Discussions
- :
- Re: How to add 45° (y=x) line to graph?

- Mark as New
- Bookmark
- Subscribe
- Mute
- Subscribe to RSS Feed
- Get Direct Link
- Report Inappropriate Content
How to add 45° (y=x) line to graph?
Does anyone have a smarter way to add a 45° (y=x) line to an x-y plot? I currently do the following:
- Set x-axis and y-axis pixels to the same value in the Frame Size dialog
- Use the drawing tool to manually add a line to the plot
The line is never quite perfect and has to be adjusted when plot is changed.
JMP Developers: this would be a great option to add to: Y-axis specification, Reference Lines. It is useful when comparing predicted versus actual; lab determinations versus standard values; etc.. Thinking about this more, having the option to enter f(x) for a y-reference line would be even better than just the 45° (y=x) line.
Accepted Solutions

- Mark as New
- Bookmark
- Subscribe
- Mute
- Subscribe to RSS Feed
- Get Direct Link
- Report Inappropriate Content
Re: How to add 45° (y=x) line to graph?
In the Fit Y by X platform you can choose Fit special... and lock intercept to zero and slope to one.
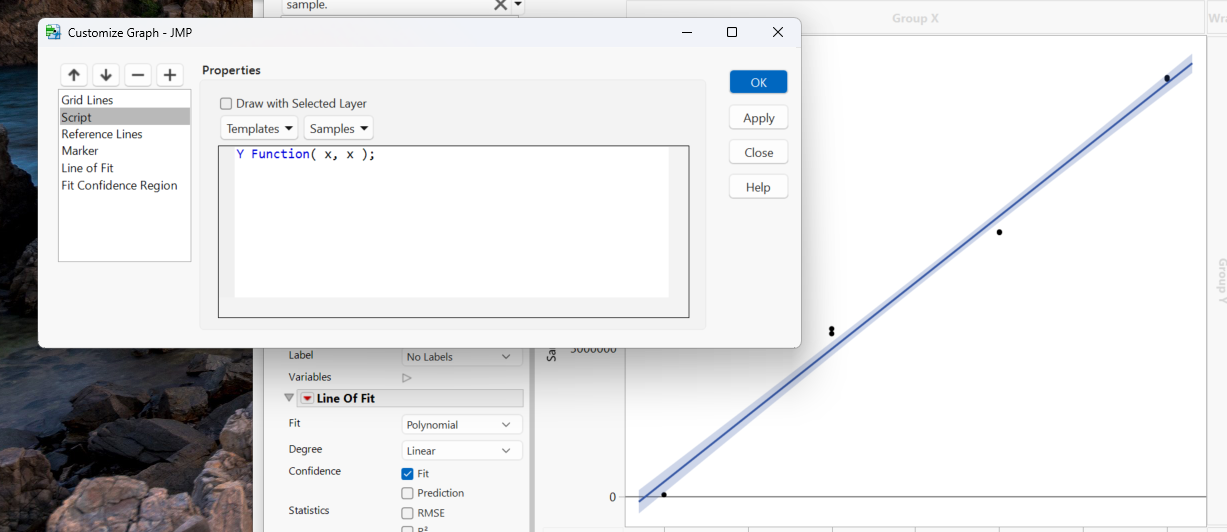
In most platforms it is also possible to draw a line representing a function by a graphics script. Right-click on the graph and select Customize... In the dialog press the plus sign and select Y Function in the Templates drop-down menu. Add Y Function( y = x, x ); to get a straight y=x line.
JSL-example:
dt = Open( "$SAMPLE_DATA/Fitness.jmp" );
biv = dt << Bivariate( Y( :MaxPulse ), X( :RunPulse ) );
Report( Biv )[Framebox( 1 )] << add graphics script( Y Function( y = x, x ) );
- Mark as New
- Bookmark
- Subscribe
- Mute
- Subscribe to RSS Feed
- Get Direct Link
- Report Inappropriate Content
Re: How to add 45° (y=x) line to graph?
In the Fit Y by X platform you can choose Fit special... and lock intercept to zero and slope to one.
In most platforms it is also possible to draw a line representing a function by a graphics script. Right-click on the graph and select Customize... In the dialog press the plus sign and select Y Function in the Templates drop-down menu. Add Y Function( y = x, x ); to get a straight y=x line.
JSL-example:
dt = Open( "$SAMPLE_DATA/Fitness.jmp" );
biv = dt << Bivariate( Y( :MaxPulse ), X( :RunPulse ) );
Report( Biv )[Framebox( 1 )] << add graphics script( Y Function( y = x, x ) );

- Mark as New
- Bookmark
- Subscribe
- Mute
- Subscribe to RSS Feed
- Get Direct Link
- Report Inappropriate Content
Re: How to add 45° (y=x) line to graph?
Very cool. I tried it in Graph Builder and it works like a charm. Here's an example:
dt = open("$sample_data\Boston Housing.jmp");

gb = Graph Builder(
    Show Control Panel( 0 ),
    Variables( X( :rooms ), Y( :distance ) ),
    Elements( Points( X, Y, Legend( 1 ) ) ),
    SendToReport(
        Dispatch( {}, "rooms", ScaleBox,
            {Min( 0 ), Max( 12 ), Inc( 2 ), Minor Ticks( 1 )} ),
        Dispatch( {}, "distance", ScaleBox,
            {Min( 0 ), Max( 12 ), Inc( 2 ), Minor Ticks( 1 )} ),
        Dispatch( {}, "Graph Builder", FrameBox,
            {Marker Size( 3 ), Add Graphics Script(
                2, Description( "Script" ), Y Function( x, x )
            ), Grid Line Order( 1 ), Reference Line Order( 3 )} )
    )
);

- Mark as New
- Bookmark
- Subscribe
- Mute
- Subscribe to RSS Feed
- Get Direct Link
- Report Inappropriate Content
Re: How to add 45° (y=x) line to graph?
Here is another script using the Bivariate platform (I use JMP 10.0.2):
dt = Open("$SAMPLE_DATA/Fitness.jmp");

dt << Bivariate(
  Y(:MaxPulse),
  X(:RunPulse),
  SendToReport(
  Dispatch(
  {},
  "Bivar Plot",
  FrameBox,
  {Add Graphics Script(2, Description("Script"), YFunction(x, x)),
  Grid Line Order(1), Reference Line Order(3)}
  )
  )
);

- Mark as New
- Bookmark
- Subscribe
- Mute
- Subscribe to RSS Feed
- Get Direct Link
- Report Inappropriate Content
Re: How to add 45° (y=x) line to graph?
How can the 45 degree reference line be reformatted as dashes and alternate color?

- Mark as New
- Bookmark
- Subscribe
- Mute
- Subscribe to RSS Feed
- Get Direct Link
- Report Inappropriate Content
Re: How to add 45° (y=x) line to graph?
Here is a version of the platform with the line dashed and red
dt = Open( "$sample_data\Boston Housing.jmp" );

gb = Graph Builder(
       Show Control Panel( 0 ),
       Variables( X( :rooms ), Y( :distance ) ),
       Elements( Points( X, Y, Legend( 1 ) ) ),
       SendToReport(
              Dispatch( {}, "rooms", ScaleBox, {Min( 0 ), Max( 12 ), Inc( 2 ), Minor Ticks( 1 )} ),
              Dispatch( {}, "distance", ScaleBox, {Min( 0 ), Max( 12 ), Inc( 2 ), Minor Ticks( 1 )} ),
              Dispatch(
                     {},
                                         "Graph Builder",
                     FrameBox,
                     {Marker Size( 3 ), Add Graphics Script(
                                                     2,
                           Description( "Script" ),
                                                     Pen Color( "red" );
                                                    Line Style( "dashed" );
                                                   Y Function( x, x );
                     ), Grid Line Order( 1 ), Reference Line Order( 3 )}
              )
       )
);
The Graphing Elements are documented in the Scripting Guide, starting on page 497. The Scripting Guide is available under the JMP Help==>Books==>Scripting Guide.

- Mark as New
- Bookmark
- Subscribe
- Mute
- Subscribe to RSS Feed
- Get Direct Link
- Report Inappropriate Content
Re: How to add 45° (y=x) line to graph?


- Mark as New
- Bookmark
- Subscribe
- Mute
- Subscribe to RSS Feed
- Get Direct Link
- Report Inappropriate Content
Re: How to add 45° (y=x) line to graph?
Hello,
I've tried to use this feature to make a reference line but it's not working. Can someone help me figure out why?
- Mark as New
- Bookmark
- Subscribe
- Mute
- Subscribe to RSS Feed
- Get Direct Link
- Report Inappropriate Content
Re: How to add 45° (y=x) line to graph?
can you share a larger screenshot? what is your x and y range?
Recommended Articles
- © 2026 JMP Statistical Discovery LLC. All Rights Reserved.
- Terms of Use
- Privacy Statement
- Contact Us