- Subscribe to RSS Feed
- Mark Topic as New
- Mark Topic as Read
- Float this Topic for Current User
- Bookmark
- Subscribe
- Mute
- Printer Friendly Page
Discussions
Solve problems, and share tips and tricks with other JMP users.- JMP User Community
- :
- Discussions
- :
- How do we filter data based on time and take the average using JSL?
- Mark as New
- Bookmark
- Subscribe
- Mute
- Subscribe to RSS Feed
- Get Direct Link
- Report Inappropriate Content
How do we filter data based on time and take the average using JSL?
I have data captured for a particular duration of time. Please find below snapshot of the table (attached the same):
| TimeStamp | A | B | C |
| 0.001 | 10.005 | 450.4451 | 428.9093 |
| 0.002 | 10.01 | 450.8904 | 429.0295 |
| 0.003 | 10.015 | 451.336 | 429.0177 |
| 0.004 | 10.02 | 451.7818 | 428.9279 |
| 0.005 | 10.025 | 452.2278 | 428.8491 |
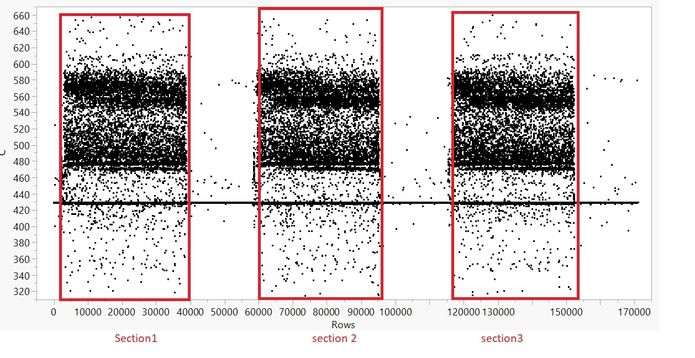
The plot of column C looks like below:
I need to filter the rows in section1 , 2 & 3 and find their average.
Each section spans for 30second duration which is calculated from timestamp column and there is a 20 second interval between each section.
The final result table should be as below:
| Section | mean(A) | mean(B) | mean(C) |
| 1 | 10.005 | 450.4451 | 428.9093 |
| 2 | 10.01 | 450.8904 | 429.0295 |
| 3 | 10.015 | 451.336 | 429.0177 |
Could you please advise how can we filter the rows in section1 , 2 & 3 and find their average using script.
Accepted Solutions
- Mark as New
- Bookmark
- Subscribe
- Mute
- Subscribe to RSS Feed
- Get Direct Link
- Report Inappropriate Content
Re: How do we filter data based on time and take the average using JSL?
Here is how I would do it. It does not match your results, but it does follow the directions you indicated, calculating the Section based upon the TimeStamp values of 0-30 = Section 1, 50-80 = Section 2, 100-130 = Section 3
names default to here(1);
dt=current data table();
dt << new column("Section",
	ordinal,
	formula(
		If( 0 <= :TimeStamp <= 30,
			1,
			50 <= :TimeStamp <= 80,
			2,
			100 <= :TimeStamp <= 130,
			3
		)
	)
);

dt << Summary(
	Group( :Section ),
	Mean( :A ),
	Mean( :B ),
	Mean( :C ),
	Freq( "None" ),
	Weight( "None" ),
	Link to original data table( 0 )
);- Mark as New
- Bookmark
- Subscribe
- Mute
- Subscribe to RSS Feed
- Get Direct Link
- Report Inappropriate Content
Re: How do we filter data based on time and take the average using JSL?
Is it possible to give some meaningful names to each section instead of 1, 2 and 3. For example can we name it as interval_1, interval_2 etc.
I tried this but the code doesn't run when I try it
- Mark as New
- Bookmark
- Subscribe
- Mute
- Subscribe to RSS Feed
- Get Direct Link
- Report Inappropriate Content
Re: How do we filter data based on time and take the average using JSL?
In the example I provided, the Section column was created as a Numeric column. The values for numeric columns have to be valid numbers. However, it is a simple matter to make the column a Character column and then the values of Section can be anything you want.
names default to here(1);
dt=current data table();
dt << new column("Section",
	ordinal,character,
	formula(
		If( 0 <= :TimeStamp <= 30,
			"Interval_1",
			50 <= :TimeStamp <= 80,
			"Interval_2",
			100 <= :TimeStamp <= 130,
			"Interval_3"
		)
	)
);
I strongly suggest that you take the time to read the Discovering JMP and Using JMP documents from the JMP Documentation Library available under the Help pull down menu
- Mark as New
- Bookmark
- Subscribe
- Mute
- Subscribe to RSS Feed
- Get Direct Link
- Report Inappropriate Content
Re: How do we filter data based on time and take the average using JSL?
Recommended Articles
- © 2026 JMP Statistical Discovery LLC. All Rights Reserved.
- Terms of Use
- Privacy Statement
- Contact Us


