- Subscribe to RSS Feed
- Mark Topic as New
- Mark Topic as Read
- Float this Topic for Current User
- Bookmark
- Subscribe
- Mute
- Printer Friendly Page
Discussions
Solve problems, and share tips and tricks with other JMP users.- JMP User Community
- :
- Discussions
- :
- How do I get the y-axis to reflect the numbers in my x-axis columns in graph bui...
- Mark as New
- Bookmark
- Subscribe
- Mute
- Subscribe to RSS Feed
- Get Direct Link
- Report Inappropriate Content
How do I get the y-axis to reflect the numbers in my x-axis columns in graph builder?
Hi All,
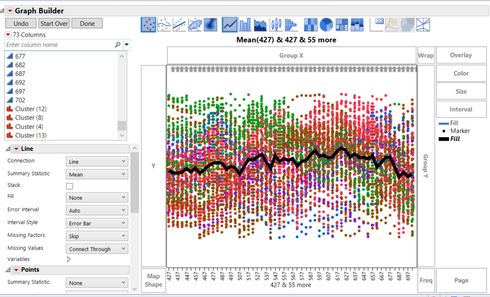
I am plotting spectral signatures of marine macro-algae. I have 55 columns that I put into the x-axis, but the y-axis does not auto reflect the numbers that are contained in the x-axis columns. My x-axis columns are formatted as continuous numeric fixed decimal (2) in both datasheets. This is what it looks like when I plot it:
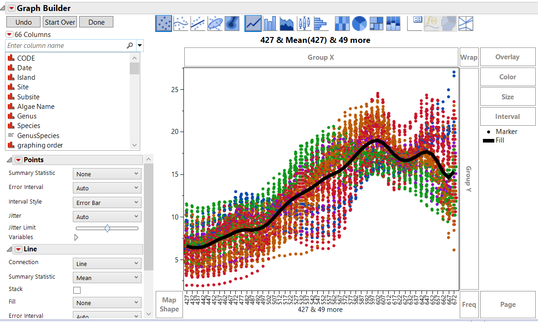
I found out how to do this once before so that it works as auto-populating the y-axis with a different datasheet, but similarly spectral signatures that have a distinct data layout, but have now spent about a day trying to figure out the answer and could not find it. This is what it should look like with the values on the y-axis auto-populating to the actual values reflected in my x-axis column. I do not want to transform my data for these graphs and want them to show the actual values in my columns.
I am using jmpPro 16.0.0 on with Windows (not a mac). I mostly use the user interface- have not scripted much.
Appreciate any help someone could provide.
- Tags:
- windows
- Mark as New
- Bookmark
- Subscribe
- Mute
- Subscribe to RSS Feed
- Get Direct Link
- Report Inappropriate Content
Re: How do I get the y-axis to reflect the numbers in my x-axis columns in graph builder?
I do not have an answer to your question. I have a suggestion in a different direction, though. Please see the Functional Data Explorer. It is designed to help explore and analyze functions such as profiles, curves, and spectra.
- Mark as New
- Bookmark
- Subscribe
- Mute
- Subscribe to RSS Feed
- Get Direct Link
- Report Inappropriate Content
Re: How do I get the y-axis to reflect the numbers in my x-axis columns in graph builder?
Hello, happy to try and provide some input but it would be helpful to have some more details on what your two datasets look like.
My first thought is that you would really benefit from stacking your data table as it appears you have each wavelength or organism as a separate column. To do that go to Tables > Stack and put all the wavelength columns in the Stack Columns input window. This will give you a table that has one column for your wavelength and one column for your response value. No scripting required and you still have your original units.
If you want to use information from two datasets you likely need to use some type of a table join or virtual join. Again, it is tough to say exactly but hope this is helpful. As Mark mentioned, FDE is a great tool if you have JMP PRO.
Recommended Articles
- © 2026 JMP Statistical Discovery LLC. All Rights Reserved.
- Terms of Use
- Privacy Statement
- Contact Us


