- New to JMP? Join us Sept. 23-24 for the Early User Edition of Discovery Summit, tailor-made for new users. Register now for free!
- Use World Cup data to build models, explore spatial relationships, and create informative visualizations in JMP. Register. July 17, 2 pm US Eastern Time.
- Your voice matters! Tell us how you prefer to receive JMP updates, so we can tailor our communication to your needs. Take short survey.
- Subscribe to RSS Feed
- Mark Topic as New
- Mark Topic as Read
- Float this Topic for Current User
- Bookmark
- Subscribe
- Mute
- Printer Friendly Page
Discussions
Solve problems, and share tips and tricks with other JMP users.- JMP User Community
- :
- Discussions
- :
- Guidance on appropriate analyses

- Mark as New
- Bookmark
- Subscribe
- Mute
- Subscribe to RSS Feed
- Get Direct Link
- Report Inappropriate Content
Guidance on appropriate analyses
I am trying to relearn JMP and the appropriate stats to use. I would really appreciate help trying to determine which analyses are most appropriate given the dataset. I have a dataset of whale sightings collected from aerial and vessel surveys with 3 different environmental covariates [distance from shore (km), depth (m), and Sea Surface Temperature (SST degrees C)].
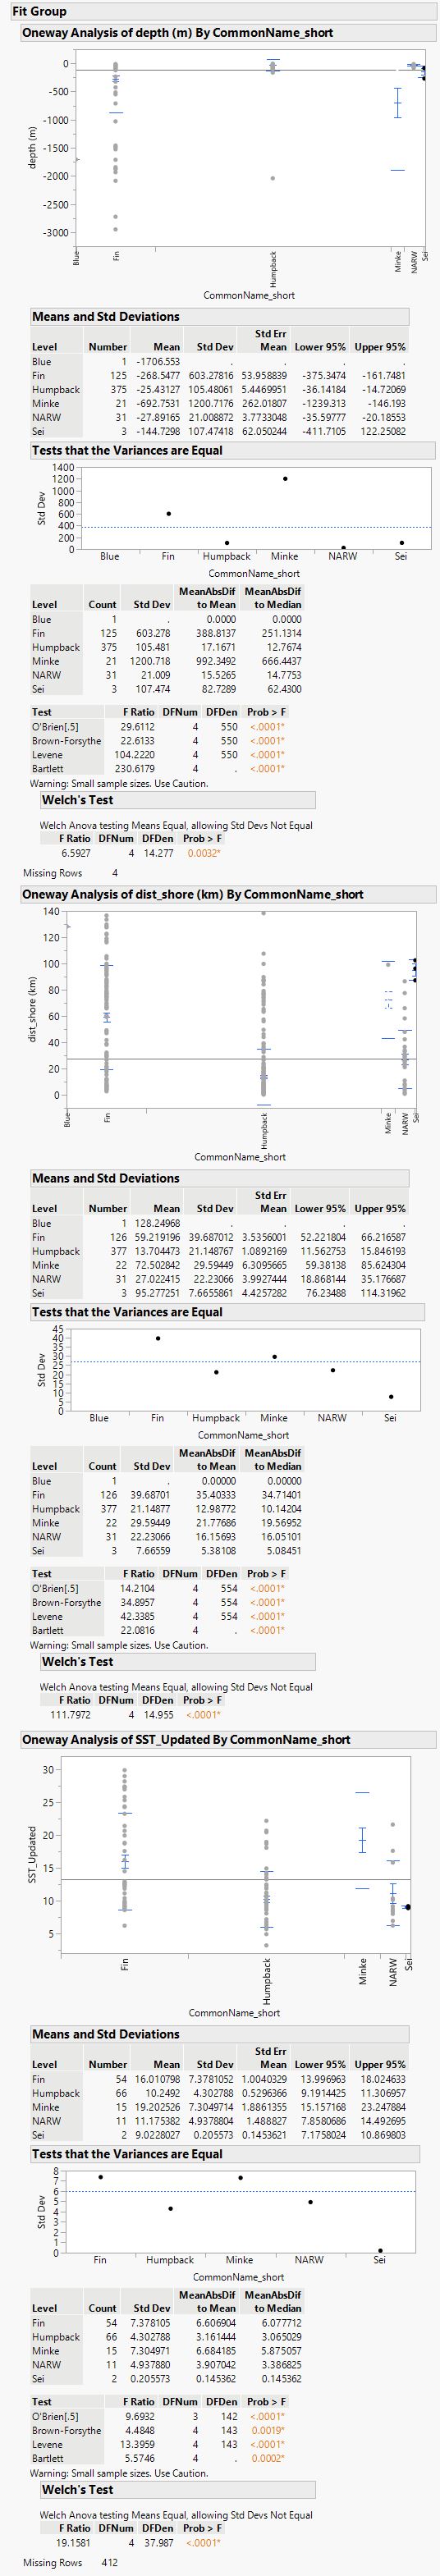
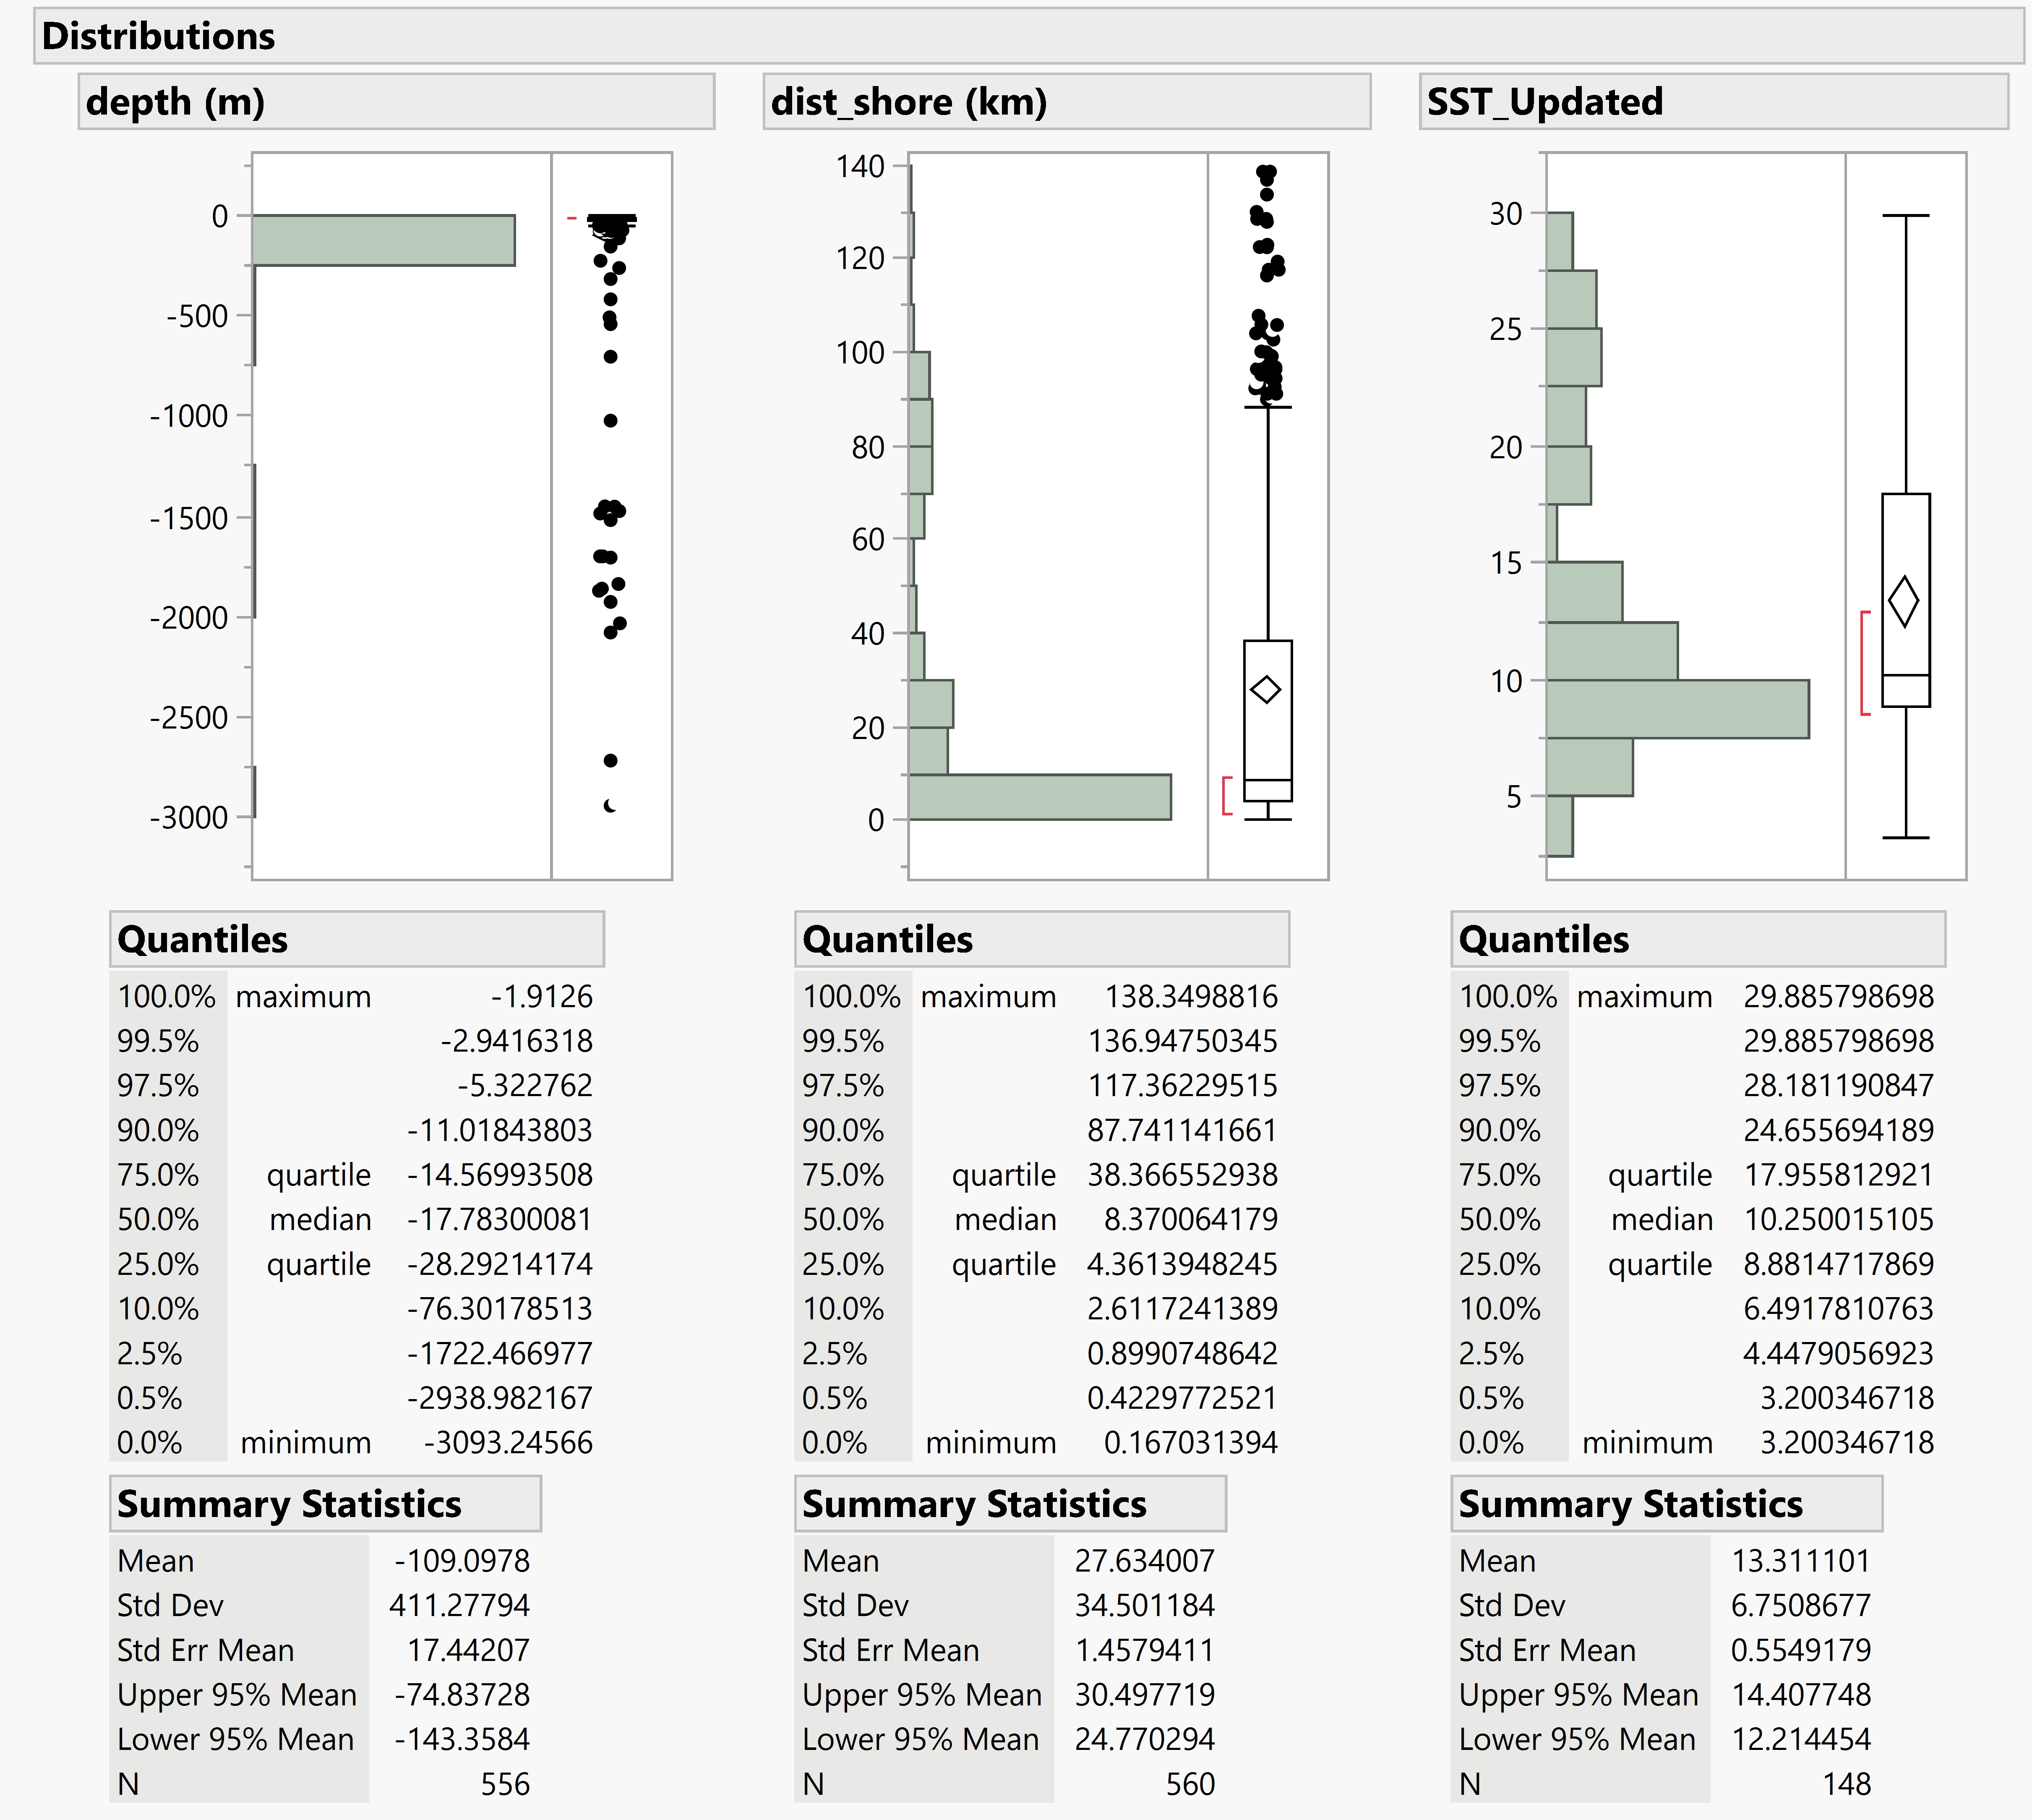
I have attached the summary stats for the (1) covariates only and, (2) for the covariates X Species (‘common name short’).
Generally, the data are not normally distributed and heteroscedastic for at least distance from shore, and depth. Also variances are not homogenous therefore I expect nonparametric tests are the way to go.
The questions I am interested in are as follows:
(1) Is there a significant difference between species for three different variables?
--distance from shore
-- depth
--SST?
(1a) Is there a seasonal effect of distribution based on the three variables above. (I.e. between winter, spring, summer, fall)?
(2) Is there a significant difference in group size between seasons?
(2b) Is there an effect of species on group size by season?
I would sincerely appreciate guidance as to what is the most appropriate analyses are given the data and how to properly report the results from the chosen tests. THANK YOU!!

- Mark as New
- Bookmark
- Subscribe
- Mute
- Subscribe to RSS Feed
- Get Direct Link
- Report Inappropriate Content
Re: Guidance on appropriate analyses
Welcome to the community. I have some questions and then some guesses. How was the data acquired? Can you attach the JMP table? Assuming the response is count data, how many sightings are there? How confident are you in the accuracy of the data? Is the seasonal data and time series in the data set? I always start by looking at the data. Try Graph Builder and you can drop the variables into the drop zones to arrange the data many ways. Then maybe logistic regression (or standard least squares if there is enough count data). Also check for multicollinearity (VIF's or Multivariate Methods>Multivariate) and outlier data points.

- Mark as New
- Bookmark
- Subscribe
- Mute
- Subscribe to RSS Feed
- Get Direct Link
- Report Inappropriate Content
Re: Guidance on appropriate analyses
Take a look at this example. Its similar to your problem, might get you going in the right direction.
- Mark as New
- Bookmark
- Subscribe
- Mute
- Subscribe to RSS Feed
- Get Direct Link
- Report Inappropriate Content
Re: Guidance on appropriate analyses
I thank each of you so much for the feedback! I can't tell you how grateful I am for this guidance as I'm reteaching my self and feel quite naiive and buried in all the rabbit holes I've dug into, at this point.
I hadn't considered repeated measures so I am looking more into the example with the link that was sent. I expected non parametric tests would be the way to go so I will look into these other suggestions. Thank you!
I am very confident in the data. It was all systematically collected, managed and QAQCed based on standard protocols across the almost 20 years of the study. The only data that wasn't directly collected is the environmental data. It was annotated from Movebank a reputable and respected site for environmental data and animal tracking data (https://www.movebank.org/cms/movebank-content/envdata-products). Not all sightings have associated environmental data.
I
The questions I have in regards to the most appropriate analyses.
- determine if there is a difference in group size between seasons.
- determine if there are differences between species relative to depth, distance to shore, and SST.
Regarding the point on outliers, I also wondered about this with regards to the environmental data. There are a few points that are exceptionally large for depth, but there are several records in the 3 thousand meter depth for 3 different species that are known to spend time offshore near deep water canyons. So I am cautious in removing these 'outliers' as they may very well reflect ecologically interesting and valid observations.
Thanks again!
- Mark as New
- Bookmark
- Subscribe
- Mute
- Subscribe to RSS Feed
- Get Direct Link
- Report Inappropriate Content
Re: Guidance on appropriate analyses
Sorry, I'm tied up today. Why don't you attach JMP files?
My question about the validity of the data includes how do you know the same whales are counted more than once? My suggestion of looking for outlier data points is not so you can remove them. They are often the most informative part of a data set, but you do need to realize they can distort quantitative analysis.

- Mark as New
- Bookmark
- Subscribe
- Mute
- Subscribe to RSS Feed
- Get Direct Link
- Report Inappropriate Content
Re: Guidance on appropriate analyses
Recommended Articles
- © 2026 JMP Statistical Discovery LLC. All Rights Reserved.
- Terms of Use
- Privacy Statement
- Contact Us