When using Graph builder, generally, the axis scale (min, max) is set to reasonable values according to the data range.
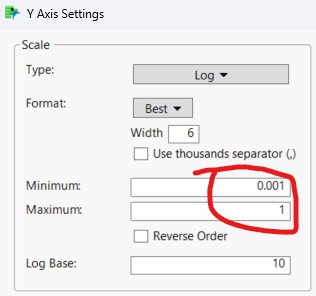
But when I set the scale type to 'Log', the scale range will be set to 1E-3 to 1, while my minimum data point down to 1E-12 level.
This makes the curve outside of the graph window, unless I modify the min/max range manually.
But I'm using JSL to process different of data sources. The data structure/range may be so different, it's hard to define a proper range for all the data source.
So is there any method to make jmp auto scale the axis using JSL?

