Turn on suggestions
Auto-suggest helps you quickly narrow down your search results by suggesting possible matches as you type.
Options
- Subscribe to RSS Feed
- Mark Topic as New
- Mark Topic as Read
- Float this Topic for Current User
- Bookmark
- Subscribe
- Mute
- Printer Friendly Page
Discussions
Solve problems, and share tips and tricks with other JMP users.- JMP User Community
- :
- Discussions
- :
- Graph Builder: reverse scale - bug?
- Mark as New
- Bookmark
- Subscribe
- Mute
- Subscribe to RSS Feed
- Get Direct Link
- Report Inappropriate Content
Graph Builder: reverse scale - bug?
Created:
Mar 3, 2023 02:36 PM
| Last Modified: Jun 8, 2023 9:31 AM
(1939 views)
Hi,
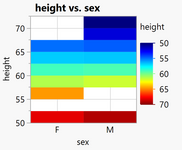
when I reverse the scale of the Legend in Graph Builder, the colors in the graph are inverted as well.
For the colors in the graph, reverse scale and reverse colors has the same effect:
As a result, in this plot, the colors run from red to blue for height 50 -> 70.
And in the legend the colors run from blue to red for height 50-> 70.
I tested it with Jmp 16 & 17. So if it's a bug, it's there for some while ...
So, I guess it's a feature. But I cannot imagine how it could be a feature.
Graph Builder(
	Show Control Panel( 0 ),
	Variables( X( :sex ), Y( :height ), Color( :height ) ),
	Elements( Heatmap( X, Y, Legend( 6 ) ) ),
	SendToReport(
		Dispatch(
			{},
			"400",
			ScaleBox,
			{Legend Model(
				6,
				Properties(
					0,
					{gradient(
						{Color Theme( "Jet"(1) ), Reverse Labels( 1 )}
					)},
					Item ID( "height", 1 )
				)
			)}
		)
	)
)
1 ACCEPTED SOLUTION
Accepted Solutions
- Mark as New
- Bookmark
- Subscribe
- Mute
- Subscribe to RSS Feed
- Get Direct Link
- Report Inappropriate Content
Re: Graph Builder: reverse scale - bug?
Good catch, @hogi! That does appear to be a defect and I've reported it to JMP Tech Support on your behalf.
2 REPLIES 2
- Mark as New
- Bookmark
- Subscribe
- Mute
- Subscribe to RSS Feed
- Get Direct Link
- Report Inappropriate Content
Re: Graph Builder: reverse scale - bug?
- Mark as New
- Bookmark
- Subscribe
- Mute
- Subscribe to RSS Feed
- Get Direct Link
- Report Inappropriate Content
Re: Graph Builder: reverse scale - bug?
Jmp 17.2:
Recommended Articles
- © 2026 JMP Statistical Discovery LLC. All Rights Reserved.
- Terms of Use
- Privacy Statement
- Contact Us


