- Don’t miss your chance to experience Discovery Summit Europe at our best available rate! Early bird registration through 31 Oct.
- Graph Builder Toolbar streamlines interactive graphing. Creates shortcuts on Report and GraphBuilder Helpers toolbars. Download and install the extension.
- Subscribe to RSS Feed
- Mark Topic as New
- Mark Topic as Read
- Float this Topic for Current User
- Bookmark
- Subscribe
- Mute
- Printer Friendly Page
Discussions
Solve problems, and share tips and tricks with other JMP users.- User Community
- :
- Discussions
- :
- Generating sparklines for each row in a column

- Mark as New
- Bookmark
- Subscribe
- Mute
- Subscribe to RSS Feed
- Get Direct Link
- Report Inappropriate Content
Generating sparklines for each row in a column
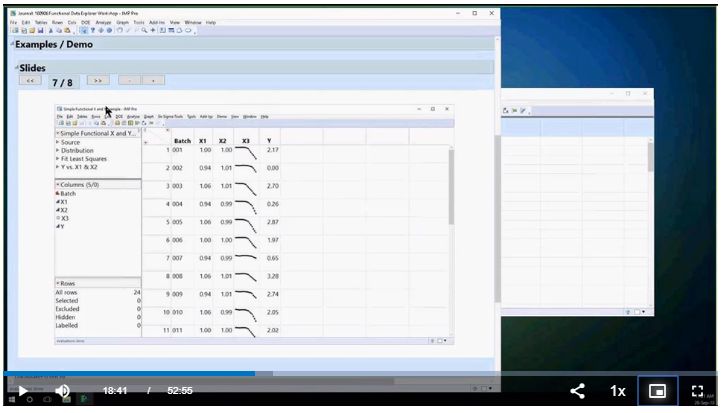
What I want to do is something I have seen in one of the FDE tutorials Using JMP® Pro to Pre-Process Functional Data and Create Surrogate Models, but I can't find the code that describes how the shown data was created:
How would I create a column like X3 with my own data?
Is X3 an interactive column (e.g., can be modified or updated) or just a picture column like I have seen in other examples like the Big class families sample data?
The former would be more interesting, but I could live with the latter if necessary.
Many thanks for your help
Accepted Solutions


 Community Manager
- Mark as New
- Bookmark
- Subscribe
- Mute
- Subscribe to RSS Feed
- Get Direct Link
- Report Inappropriate Content
Re: Generating sparklines for each row in a column
Hi @Feli,
Create a graph using graph builder.
Click the Make Into Data Table option from the red triangle to create a table of graphs.
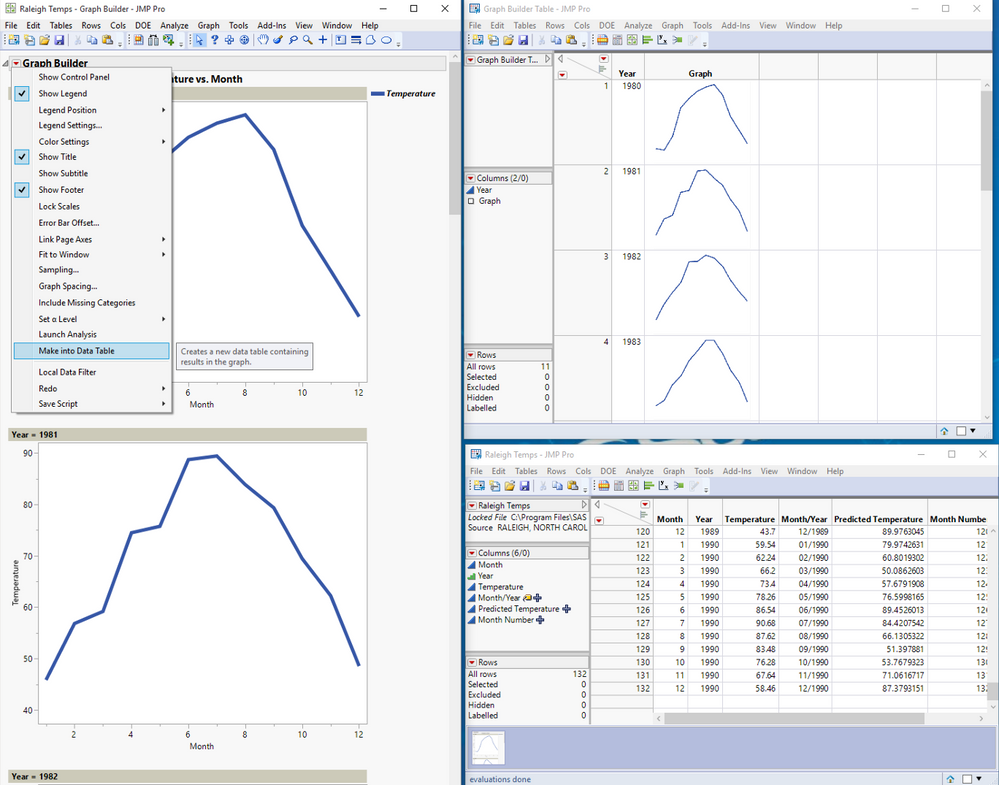
Using the Raleigh Temps sample data table I created a line graph using Graph Builder as follows--
I changed year to ordinal from continuous so I can have a single year for each graph.
Y: Temperature
X: Month
Page By: Year
JSL Script for creating the graph--
Graph Builder(
	Variables( X( :Month ), Y( :Temperature ), Page( :Year ) ),
	Elements( Line( X, Y, Legend( 4 ) ) ),
	SendToReport(
		Dispatch(
			{},
			"400",
			ScaleBox,
			{Legend Model(
				4,
				Properties( -1, {Line Width( 4 )}, Item ID( "Mean", 1 ) )
			)}
		)
	)
);
Community Manager
- Mark as New
- Bookmark
- Subscribe
- Mute
- Subscribe to RSS Feed
- Get Direct Link
- Report Inappropriate Content
Re: Generating sparklines for each row in a column
Hi @Feli,
Create a graph using graph builder.
Click the Make Into Data Table option from the red triangle to create a table of graphs.
Using the Raleigh Temps sample data table I created a line graph using Graph Builder as follows--
I changed year to ordinal from continuous so I can have a single year for each graph.
Y: Temperature
X: Month
Page By: Year
JSL Script for creating the graph--
Graph Builder(
	Variables( X( :Month ), Y( :Temperature ), Page( :Year ) ),
	Elements( Line( X, Y, Legend( 4 ) ) ),
	SendToReport(
		Dispatch(
			{},
			"400",
			ScaleBox,
			{Legend Model(
				4,
				Properties( -1, {Line Width( 4 )}, Item ID( "Mean", 1 ) )
			)}
		)
	)
);

- Mark as New
- Bookmark
- Subscribe
- Mute
- Subscribe to RSS Feed
- Get Direct Link
- Report Inappropriate Content
Re: Generating sparklines for each row in a column
Thanks for sharing this.
Excel and Gsheets have a direct way to create sparklines with a simple formula.
I wonder when JMP will include that on their headers (so far only showing distributions).
https://community.jmp.com/t5/JMP-Wish-List/Column-headers-with-sparklines/idi-p/279970
Recommended Articles
- © 2026 JMP Statistical Discovery LLC. All Rights Reserved.
- Terms of Use
- Privacy Statement
- Contact Us