- New to JMP? Join us Sept. 23-24 for the Early User Edition of Discovery Summit, tailor-made for new users. Register now for free!
- Your voice matters! Tell us how you prefer to receive JMP updates, so we can tailor our communication to your needs. Take short survey.
- See how to access JMP Marketplace - and - find, create & share add-ins to extend your JMP. Watch video.
- Subscribe to RSS Feed
- Mark Topic as New
- Mark Topic as Read
- Float this Topic for Current User
- Bookmark
- Subscribe
- Mute
- Printer Friendly Page
Discussions
Solve problems, and share tips and tricks with other JMP users.- JMP User Community
- :
- Discussions
- :
- Formatting elements in Graph Builder

- Mark as New
- Bookmark
- Subscribe
- Mute
- Subscribe to RSS Feed
- Get Direct Link
- Report Inappropriate Content
Formatting elements in Graph Builder
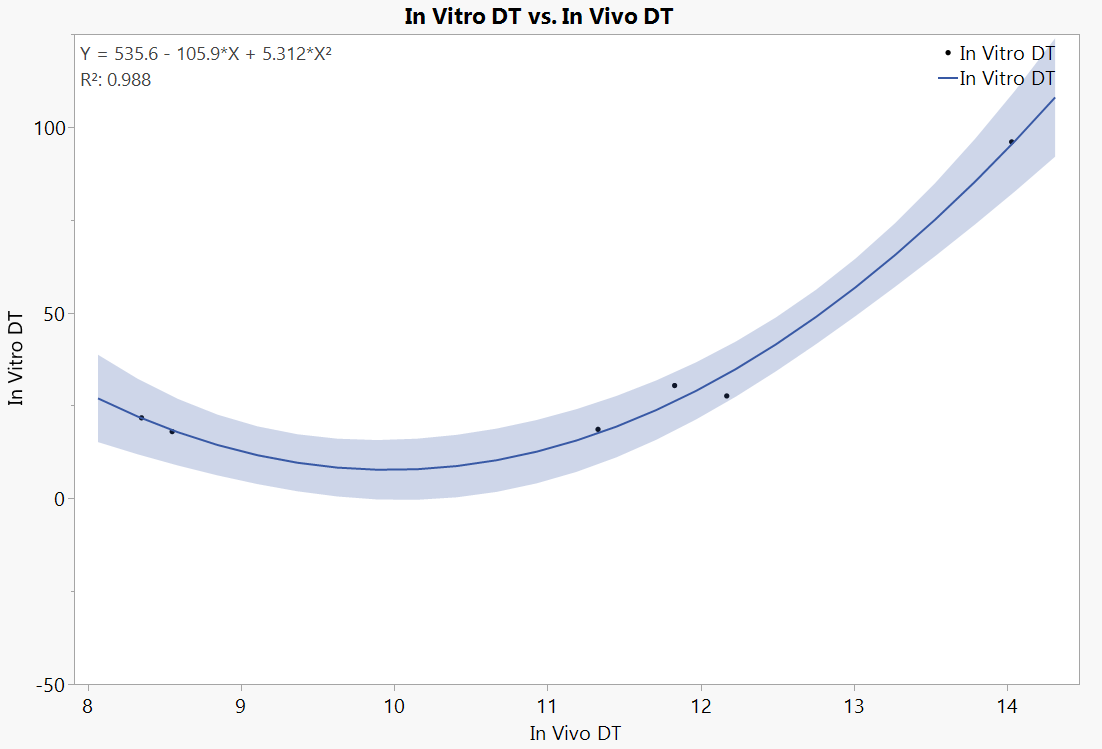
Hello - I'm going crazy because I can't figure out a way to change the number for decimals shown in my graph from 3 decimals to 2 decimal points.
I have tried multiple menu options and I can't find an option to format R2 on the Line of Fit in graph builder. Can someone tell me how do I change the format so the graph shows ONLY 2 decimal point on the R2 and the formula prediction? See the JSL from the platform below, and attached picture with the elements ont he graph I want to change
Graph Builder(
	Size( 1078, 745 ),
	Lock Scales( 1 ),
	Set α Level( 0.05 ),
	Variables( X( :In Vivo DT ), Y( :In Vitro DT ) ),
	Elements(
		Points( X, Y, Legend( 5 ) ),
		Line Of Fit( X, Y, Legend( 7 ), Degree( "Quadratic" ), R²( 1 ), Equation( 1 ) )
	),
	SendToReport(
		Dispatch( {}, "In Vivo DT", ScaleBox,
			{Format( "Fixed Dec", 12, 0 ), Min( 7.9098 ), Max( 14.4702 ), Inc( 1 ), Minor Ticks( 0 )}
		),
		Dispatch( {}, "In Vitro DT", ScaleBox,
			{Format( "Fixed Dec", 12, 0 ), Min( -50 ), Max( 125 ), Inc( 50 ), Minor Ticks( 1 )}
		)
	)
);
Edit by txnelson of JSL into JSL Display Box

- Mark as New
- Bookmark
- Subscribe
- Mute
- Subscribe to RSS Feed
- Get Direct Link
- Report Inappropriate Content
Re: Formatting elements in Graph Builder
I'm not sure if that can be modified without JSL. You can access the TextSeg in the framebox, get text, modify it and then set the modified text
Names Default To Here(1);

dt = open("$SAMPLE_DATA/Big Class.jmp");

gb = dt << Graph Builder(
	Size(525, 454),
	Show Control Panel(0),
	Variables(X(:weight), Y(:height)),
	Elements(
		Points(X, Y, Legend(9)),
		Line Of Fit(X, Y, Legend(11), R²(1), Equation(1))
	)
);

seg = (Report(gb)[framebox(1)]) << Find Seg(TextSeg(1));
orig_text = seg << Get Text;

first_part = Word([1 -2], orig_text, " ");
second_part = Word(-1, orig_text, " ");
formatted_second_part = Format(Num(second_part), "Fixed Dec", 5, 2);
final_text = first_part || " " || formatted_second_part;

seg << Set Text(final_text);
If it isn't possible to do this without JSL (not sure like I said) might be worth making wish list item about this.
Recommended Articles
- © 2026 JMP Statistical Discovery LLC. All Rights Reserved.
- Terms of Use
- Privacy Statement
- Contact Us