- Subscribe to RSS Feed
- Mark Topic as New
- Mark Topic as Read
- Float this Topic for Current User
- Bookmark
- Subscribe
- Mute
- Printer Friendly Page
Discussions
Solve problems, and share tips and tricks with other JMP users.- JMP User Community
- :
- Discussions
- :
- Re: Displacement of error bars on a multi-line chart
- Mark as New
- Bookmark
- Subscribe
- Mute
- Subscribe to RSS Feed
- Get Direct Link
- Report Inappropriate Content
Displacement of error bars on a multi-line chart
Hello,
I have a problem that I'm having a little trouble solving, let's see if someone can help me. I am trying to make line graph run in Graph Builder like this:
So far so good, a line chart whose statistic is the mean. The problem comes when I try to add the error bars, which causes the points to move out of the corresponding x-axis category. This causes confusion and a bad visualization of the data. Attached is the example:
Is there any way to solve this problem?
Thanks in advance!
Quique
Accepted Solutions
- Mark as New
- Bookmark
- Subscribe
- Mute
- Subscribe to RSS Feed
- Get Direct Link
- Report Inappropriate Content
Re: Displacement of error bars on a multi-line chart
@MRB3855 response above is the correct answer. My response below is an Old School solution. But once again, I learn something new about JMP every day.
What you are seeing is because the X axis is either nominal or ordinal. In your example it appears to be a Character column, which is nominal. If you recode the values to numeric, continuous, and then use the Value Labels column property to map the numeric values back to the 1/2 gemmes, Control, Defoliacio labels, the offsets will be eliminated.
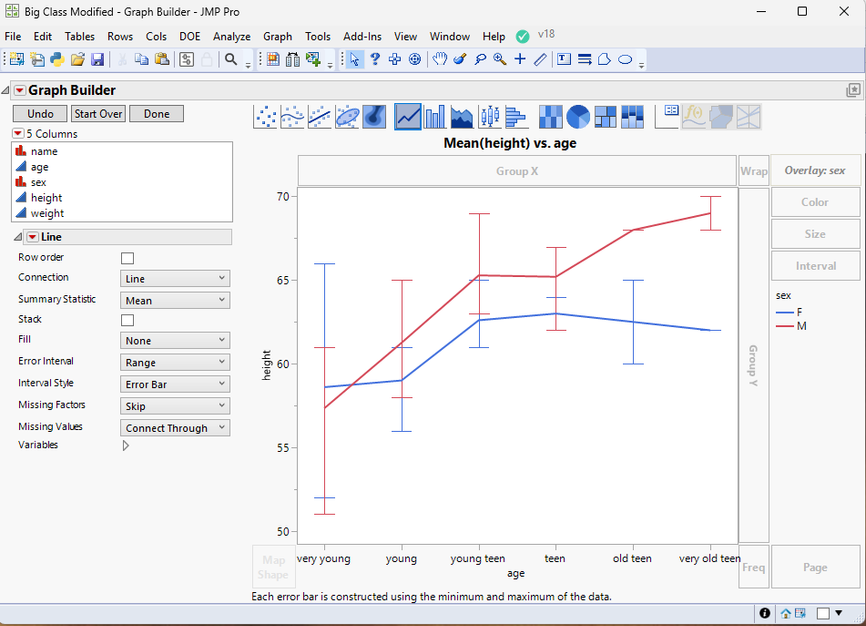
Here is an example using the sample Big Class data table where by default the Age variable is numeric, ordinal. When plotted in a similar layout as your chart, it has the same issue with the offsets.
In the below graph, I changed the age column to be continuous, and added Value Labels to convert the numeric values to be displayed as character labels and the offsets are eliminated.
- Mark as New
- Bookmark
- Subscribe
- Mute
- Subscribe to RSS Feed
- Get Direct Link
- Report Inappropriate Content
Re: Displacement of error bars on a multi-line chart
Hi @Kaik : Hmmm, how about this? Go to red triangle next to "Graph Builder" and choose "Error Bar Offset...".
- Mark as New
- Bookmark
- Subscribe
- Mute
- Subscribe to RSS Feed
- Get Direct Link
- Report Inappropriate Content
Re: Displacement of error bars on a multi-line chart
- Mark as New
- Bookmark
- Subscribe
- Mute
- Subscribe to RSS Feed
- Get Direct Link
- Report Inappropriate Content
Re: Displacement of error bars on a multi-line chart
Hi MRB,
Thanks for answering. It doesn't appear the option jitter when I choose line graph, instead of point graph!
- Mark as New
- Bookmark
- Subscribe
- Mute
- Subscribe to RSS Feed
- Get Direct Link
- Report Inappropriate Content
Re: Displacement of error bars on a multi-line chart
Hi @Kaik : Hmmm, how about this? Go to red triangle next to "Graph Builder" and choose "Error Bar Offset...".
- Mark as New
- Bookmark
- Subscribe
- Mute
- Subscribe to RSS Feed
- Get Direct Link
- Report Inappropriate Content
Re: Displacement of error bars on a multi-line chart
Thank you for the solution!!
Quique
- Mark as New
- Bookmark
- Subscribe
- Mute
- Subscribe to RSS Feed
- Get Direct Link
- Report Inappropriate Content
Re: Displacement of error bars on a multi-line chart
@MRB3855 response above is the correct answer. My response below is an Old School solution. But once again, I learn something new about JMP every day.
What you are seeing is because the X axis is either nominal or ordinal. In your example it appears to be a Character column, which is nominal. If you recode the values to numeric, continuous, and then use the Value Labels column property to map the numeric values back to the 1/2 gemmes, Control, Defoliacio labels, the offsets will be eliminated.
Here is an example using the sample Big Class data table where by default the Age variable is numeric, ordinal. When plotted in a similar layout as your chart, it has the same issue with the offsets.
In the below graph, I changed the age column to be continuous, and added Value Labels to convert the numeric values to be displayed as character labels and the offsets are eliminated.
- Mark as New
- Bookmark
- Subscribe
- Mute
- Subscribe to RSS Feed
- Get Direct Link
- Report Inappropriate Content
Re: Displacement of error bars on a multi-line chart
Thank you for your time Nelson!!
Quique
Recommended Articles
- © 2026 JMP Statistical Discovery LLC. All Rights Reserved.
- Terms of Use
- Privacy Statement
- Contact Us


