- Subscribe to RSS Feed
- Mark Topic as New
- Mark Topic as Read
- Float this Topic for Current User
- Bookmark
- Subscribe
- Mute
- Printer Friendly Page
Discussions
Solve problems, and share tips and tricks with other JMP users.- JMP User Community
- :
- Discussions
- :
- Re: Disappearance of confidence intervals on profiler
- Mark as New
- Bookmark
- Subscribe
- Mute
- Subscribe to RSS Feed
- Get Direct Link
- Report Inappropriate Content
Disappearance of confidence intervals on profiler
Good afternoon (from East Coast) JMP staffs and users!
I have three questions on using JMP software.
1. I built a customized response surface model with triplicates in the central point.
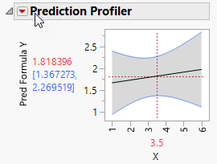
When I open the 'Profiler' from 'Fit model', it shows confidence intervals as shown below.
However, when I open this fitted model through 'Profiler' under 'Graph' tab, it does not show confidence intervals.
I also do not show CI in 'Actual by Predicted Plot'.
Do you know what might have caused this and how to fix this issue?
2. When you simulate the variables and responses, does it account for confidence intervals of response?
3. Is it possible to simulate the variables based on fixed value of response rather than the response based on maximizing the desirability?
Any answers or pointing me to relevant post would be appreciated.
Thank you!
Best,
Bumjun
Accepted Solutions
- Mark as New
- Bookmark
- Subscribe
- Mute
- Subscribe to RSS Feed
- Get Direct Link
- Report Inappropriate Content
Re: Disappearance of confidence intervals on profiler
After looking at your table, I think I see where all of the confusion is coming in!
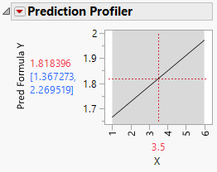
Using the Graph > Profiler, I put in your Pred Formula Y and PredSE Y columns in the the Y field. JMP then asks if I want to use PredSE Y as intervals. I say yes, and I get this plot:
You can't see the intervals, but if you adjust the Y axis, you can see them.
Now if I start over and put in the Pred Formula Y and PredSE Y 2, it does not work. Why? Well, it turns out that there is extra information in these columns that links them together. Open up the Column Info for the Pred Formula Y and click on the Predicting column property. You will see there is an ID number embedded in that property.
If you look at the Column Info for the PredSE Y column, then you will see this same ID number in the Std Error property:
But the PredSE Y 2 column has a different ID number. If you change the ID in the PredSE Y 2 so that it matches the Pred Formula Y, then the confidence intervals will show up when using Pred SE Y 2 (after adjusting the Y-axis). In other words, JMP is checking to make sure that the potential interval formula actually matches with the prediction formula. This will allow you to plot confidence intervals with multiple prediction formulas simultaneously.
- Mark as New
- Bookmark
- Subscribe
- Mute
- Subscribe to RSS Feed
- Get Direct Link
- Report Inappropriate Content
Re: Disappearance of confidence intervals on profiler
Maybe. The model error comes from the Root Mean Square Error (RMSE) of the model. So in that model fitting window go to the red triangle for the model and choose Regression Reports > Summary of Fit. Is there a non-zero number in the RMSE field? Also, that menu choice is only available from the Fit Model platform. I don't believe you get that option from the Graph > Profiler option because that is not a model fitting platform.
- Mark as New
- Bookmark
- Subscribe
- Mute
- Subscribe to RSS Feed
- Get Direct Link
- Report Inappropriate Content
Re: Disappearance of confidence intervals on profiler
Regarding your question #1: In order to show the confidence interval using Graph -> Profiler, you need to use the formula for the confidence interval. When you save the model equation from the Fit Model platform, this will only save the formula for the mean response. The confidence intervals (upper and lower) are separate formulas and each of them needs their own column. I have pasted in a screenshot below, showing how to save the formula for the confidence intervals from the Fit Model platform.
Edit: I've changed the screenshot to something more accurate. @Dan_Obermiller explained it correctly. I think you can get what you want using the first two of the highlighted options.
- Mark as New
- Bookmark
- Subscribe
- Mute
- Subscribe to RSS Feed
- Get Direct Link
- Report Inappropriate Content
Re: Disappearance of confidence intervals on profiler
Thank you Ressel,
I saved CI as a formula but still did not figure out how to apply this to the Profiler.
When I include those Lower and Upper CI on the Profiler as well as response, it does generate profiler.
Do you have any clue what I am doing wrong?
- Mark as New
- Bookmark
- Subscribe
- Mute
- Subscribe to RSS Feed
- Get Direct Link
- Report Inappropriate Content
Re: Disappearance of confidence intervals on profiler
For the confidence intervals, save the StdErr Pred Formula. Put the prediction formula for the mean AND the StdErr Pred Formula in the Y area of the Graph > Profiler dialog. JMP will then ask if you want to use the StdErr column to make intervals. Say YES, and you will have your graph.
- Mark as New
- Bookmark
- Subscribe
- Mute
- Subscribe to RSS Feed
- Get Direct Link
- Report Inappropriate Content
Re: Disappearance of confidence intervals on profiler
Hi Dan,
Thanks for the suggestions.
I just tried it as below.
However, it does not if I want to use it for CI; it spits out separate profiler for SE as below.
- Mark as New
- Bookmark
- Subscribe
- Mute
- Subscribe to RSS Feed
- Get Direct Link
- Report Inappropriate Content
Re: Disappearance of confidence intervals on profiler
Example to your question #1 attached.
- Save prediction formula (see screenshot under 2.)
- Save StdErr Pred Formula
- Go to Graph -> Profiler, select the columns as shown below into the Y, Prediction Formula role and confirm with OK.
- The below window will show up. Confirm with Yes.
- The Profiler created (right) should look exactly like the one in the Fit Model platform (left):
Thanks @Dan_Obermiller and apologies for adding to the "noise".
- Mark as New
- Bookmark
- Subscribe
- Mute
- Subscribe to RSS Feed
- Get Direct Link
- Report Inappropriate Content
Re: Disappearance of confidence intervals on profiler
You must make sure it is the PredSE Formula that is saved, not just the values.
- Mark as New
- Bookmark
- Subscribe
- Mute
- Subscribe to RSS Feed
- Get Direct Link
- Report Inappropriate Content
Re: Disappearance of confidence intervals on profiler
Thank you guys but it still dose not work.
@Dan_Obermiller, I double checked my previous column and it was saved as PredSE Formula.
@Ressel When I run Profiler with Pred Formula and PredSE that you saved as a column, it works as you have shown.
Strangely, if I make my own PredSE, which is on the last colum on the table below, then I run Profiler with 'New PredSE' rather than the one you created, it runs into the same problem. I am not sure if there is something wrong with some sort of default setting of my JMP software. @Dan_Obermiller Do you have any insight in it by chance?
Here I attach the jmp file with new PreSE column I saved from my jmp software.
- Mark as New
- Bookmark
- Subscribe
- Mute
- Subscribe to RSS Feed
- Get Direct Link
- Report Inappropriate Content
Re: Disappearance of confidence intervals on profiler
Hmm, interesting. It seems like you'll have to save the Prediction Formula and the StdErr Pred Formula in the same session, i.e. from the same instance of the Fit Model platform.
Click on the star / asterisk next to the column name of the saved columns and select Predicting for the Prediction Formula column. Then do the same for for the PredSE column but select Std Error. (see the screenshots below).
For each of the formula columns you saved, you'll find an ID in parenthesis (see screenshot below). If these IDs don't match up, the Graph Profiler will not combine the prediction formula with the standard error formula. For example, if you first save one of the formula columns from the Fit Model window, then close and re-open the Fit Model window to save the other formula column, the formula columns will have different IDs and the Graph Profiler will not combine them.
However, you can copy paste the IDs between the different columns to make Graph Profiler comply. I have done this in the example below. It is the same as the previous screenshot, but now I have copied the ID from Pred Formula Y 4 to PredSE Y 7 and Graph Profiler gave the desired result.
- Mark as New
- Bookmark
- Subscribe
- Mute
- Subscribe to RSS Feed
- Get Direct Link
- Report Inappropriate Content
Re: Disappearance of confidence intervals on profiler
After looking at your table, I think I see where all of the confusion is coming in!
Using the Graph > Profiler, I put in your Pred Formula Y and PredSE Y columns in the the Y field. JMP then asks if I want to use PredSE Y as intervals. I say yes, and I get this plot:
You can't see the intervals, but if you adjust the Y axis, you can see them.
Now if I start over and put in the Pred Formula Y and PredSE Y 2, it does not work. Why? Well, it turns out that there is extra information in these columns that links them together. Open up the Column Info for the Pred Formula Y and click on the Predicting column property. You will see there is an ID number embedded in that property.
If you look at the Column Info for the PredSE Y column, then you will see this same ID number in the Std Error property:
But the PredSE Y 2 column has a different ID number. If you change the ID in the PredSE Y 2 so that it matches the Pred Formula Y, then the confidence intervals will show up when using Pred SE Y 2 (after adjusting the Y-axis). In other words, JMP is checking to make sure that the potential interval formula actually matches with the prediction formula. This will allow you to plot confidence intervals with multiple prediction formulas simultaneously.
Recommended Articles
- © 2026 JMP Statistical Discovery LLC. All Rights Reserved.
- Terms of Use
- Privacy Statement
- Contact Us


