- Learn how to build custom Python data connectors and further customize JMP’s Data Connector Framework with the Python Data Connector Demo, available now in the JMP Marketplace!
- See how to create experiments to support product design and ID useful product features. Register for June 12 webinar, 2pm US Eastern Time.
- Subscribe to RSS Feed
- Mark Topic as New
- Mark Topic as Read
- Float this Topic for Current User
- Bookmark
- Subscribe
- Mute
- Printer Friendly Page
Discussions
Solve problems, and share tips and tricks with other JMP users.- JMP User Community
- :
- Discussions
- :
- Custom background color to show quadrants in Graph Builder

- Mark as New
- Bookmark
- Subscribe
- Mute
- Subscribe to RSS Feed
- Get Direct Link
- Report Inappropriate Content
Custom background color to show quadrants in Graph Builder
Hi,
How do I customize the background color in Graph Builder to show 4 different quadrants (i.e. Quadrant 1 is a different color than Quadrant 2 which is a different color that Quadrant 3, etc.)?
Thank you!!

Accepted Solutions

- Mark as New
- Bookmark
- Subscribe
- Mute
- Subscribe to RSS Feed
- Get Direct Link
- Report Inappropriate Content
Re: Custom background color to show quadrants in Graph Builder
JMP allows one to add graphic primitives to any of the graphical outputs within the system. So to produce the below graph

You just right click on the native graph and select "Customize". It brings up a window that allows you to add a script to the graph.

You can then take the modified graph, and do a Save Graph which will look like:
Names Default To Here( 1 );
dt = open("$SAMPLE_DATA/big class.jmp");

Graph Builder(
	Size( 528, 456 ),
	Show Control Panel( 0 ),
	Variables( X( :weight ), Y( :height ) ),
	Elements( Points( X, Y, Legend( 5 ) ) ),
	SendToReport(
		Dispatch(
			{},
			"weight",
			ScaleBox,
			{Add Ref Line( 110, "Solid", "Black", "", 1 )}
		),
		Dispatch(
			{},
			"height",
			ScaleBox,
			{Add Ref Line( 60, "Solid", "Black", "", 1 )}
		),
		Dispatch(
			{},
			"Graph Builder",
			FrameBox,
			{Add Graphics Script(
				2,
				Description( "" ),
				Transparency( 0.5 );
				Fill Color( {1, 1, .5} );
				left = Current Report()[axisbox( 1 )] << getmin;
				top = Current Report()[axisbox( 2 )] << getmax;
				right = Current Report()[axisbox( 1 )] << getmax;
				bottom = Current Report()[axisbox( 2 )] << getmin;
				Fill Color( {1, 1, .5} );
				Rect( left, top, 110, 60, fill = 1 );
				Fill Color( "red" );
				Rect( 110, top, right, 60, fill = 1 );
				Fill Color( "green" );
				Rect( left, 60, 110, bottom, fill = 1 );
				Fill Color( "orange" );
				Rect( 110, 60, right, bottom, fill = 1 );
			), Grid Line Order( 1 ), Reference Line Order( 3 ),
			DispatchSeg(
				TopSeg( 1 ),
				{Set Script(
					Transparency( 0.5 );
					Fill Color( {1, 1, .5} );
					left = Current Report()[axisbox( 1 )] << getmin;
					top = Current Report()[axisbox( 2 )] << getmax;
					right = Current Report()[axisbox( 1 )] << getmax;
					bottom = Current Report()[axisbox( 2 )] << getmin;
					Fill Color( {1, 1, .5} );
					Rect( left, top, 110, 60, fill = 1 );
					Fill Color( "red" );
					Rect( 110, top, right, 60, fill = 1 );
					Fill Color( "green" );
					Rect( left, 60, 110, bottom, fill = 1 );
					Fill Color( "orange" );
					Rect( 110, 60, right, bottom, fill = 1 );
				)}
			)}
		)
	)
);
However, there is a simpler form that most programmers find more convenient
Names Default To Here( 1 );
dt = open("$SAMPLE_DATA/big class.jmp");

gb = dt << Graph Builder(
	Size( 528, 456 ),
	Show Control Panel( 0 ),
	Variables( X( :weight ), Y( :height ) ),
	Elements( Points( X, Y, Legend( 5 ) ) )
	);
report(gb)[FrameBox(1)] << add graphics script(
	Transparency( 0.5 );
				Fill Color( {1, 1, .5} );
				left = Current Report()[axisbox( 1 )] << getmin;
				top = Current Report()[axisbox( 2 )] << getmax;
				right = Current Report()[axisbox( 1 )] << getmax;
				bottom = Current Report()[axisbox( 2 )] << getmin;
				Fill Color( {1, 1, .5} );
				Rect( left, top, 110, 60, fill = 1 );
				Fill Color( "red" );
				Rect( 110, top, right, 60, fill = 1 );
				Fill Color( "green" );
				Rect( left, 60, 110, bottom, fill = 1 );
				Fill Color( "orange" );
				Rect( 110, 60, right, bottom, fill = 1 );
);- Mark as New
- Bookmark
- Subscribe
- Mute
- Subscribe to RSS Feed
- Get Direct Link
- Report Inappropriate Content
Re: Custom background color to show quadrants in Graph Builder
JMP allows one to add graphic primitives to any of the graphical outputs within the system. So to produce the below graph
You just right click on the native graph and select "Customize". It brings up a window that allows you to add a script to the graph.
You can then take the modified graph, and do a Save Graph which will look like:
Names Default To Here( 1 );
dt = open("$SAMPLE_DATA/big class.jmp");

Graph Builder(
	Size( 528, 456 ),
	Show Control Panel( 0 ),
	Variables( X( :weight ), Y( :height ) ),
	Elements( Points( X, Y, Legend( 5 ) ) ),
	SendToReport(
		Dispatch(
			{},
			"weight",
			ScaleBox,
			{Add Ref Line( 110, "Solid", "Black", "", 1 )}
		),
		Dispatch(
			{},
			"height",
			ScaleBox,
			{Add Ref Line( 60, "Solid", "Black", "", 1 )}
		),
		Dispatch(
			{},
			"Graph Builder",
			FrameBox,
			{Add Graphics Script(
				2,
				Description( "" ),
				Transparency( 0.5 );
				Fill Color( {1, 1, .5} );
				left = Current Report()[axisbox( 1 )] << getmin;
				top = Current Report()[axisbox( 2 )] << getmax;
				right = Current Report()[axisbox( 1 )] << getmax;
				bottom = Current Report()[axisbox( 2 )] << getmin;
				Fill Color( {1, 1, .5} );
				Rect( left, top, 110, 60, fill = 1 );
				Fill Color( "red" );
				Rect( 110, top, right, 60, fill = 1 );
				Fill Color( "green" );
				Rect( left, 60, 110, bottom, fill = 1 );
				Fill Color( "orange" );
				Rect( 110, 60, right, bottom, fill = 1 );
			), Grid Line Order( 1 ), Reference Line Order( 3 ),
			DispatchSeg(
				TopSeg( 1 ),
				{Set Script(
					Transparency( 0.5 );
					Fill Color( {1, 1, .5} );
					left = Current Report()[axisbox( 1 )] << getmin;
					top = Current Report()[axisbox( 2 )] << getmax;
					right = Current Report()[axisbox( 1 )] << getmax;
					bottom = Current Report()[axisbox( 2 )] << getmin;
					Fill Color( {1, 1, .5} );
					Rect( left, top, 110, 60, fill = 1 );
					Fill Color( "red" );
					Rect( 110, top, right, 60, fill = 1 );
					Fill Color( "green" );
					Rect( left, 60, 110, bottom, fill = 1 );
					Fill Color( "orange" );
					Rect( 110, 60, right, bottom, fill = 1 );
				)}
			)}
		)
	)
);
However, there is a simpler form that most programmers find more convenient
Names Default To Here( 1 );
dt = open("$SAMPLE_DATA/big class.jmp");

gb = dt << Graph Builder(
	Size( 528, 456 ),
	Show Control Panel( 0 ),
	Variables( X( :weight ), Y( :height ) ),
	Elements( Points( X, Y, Legend( 5 ) ) )
	);
report(gb)[FrameBox(1)] << add graphics script(
	Transparency( 0.5 );
				Fill Color( {1, 1, .5} );
				left = Current Report()[axisbox( 1 )] << getmin;
				top = Current Report()[axisbox( 2 )] << getmax;
				right = Current Report()[axisbox( 1 )] << getmax;
				bottom = Current Report()[axisbox( 2 )] << getmin;
				Fill Color( {1, 1, .5} );
				Rect( left, top, 110, 60, fill = 1 );
				Fill Color( "red" );
				Rect( 110, top, right, 60, fill = 1 );
				Fill Color( "green" );
				Rect( left, 60, 110, bottom, fill = 1 );
				Fill Color( "orange" );
				Rect( 110, 60, right, bottom, fill = 1 );
);- Mark as New
- Bookmark
- Subscribe
- Mute
- Subscribe to RSS Feed
- Get Direct Link
- Report Inappropriate Content
Re: Custom background color to show quadrants in Graph Builder
Thank you so much for your help!!! I greatly appreciate it!!!

- Mark as New
- Bookmark
- Subscribe
- Mute
- Subscribe to RSS Feed
- Get Direct Link
- Report Inappropriate Content
Re: Custom background color to show quadrants in Graph Builder
Hello,
Interesting to be able to mark certain parts of the graph with a color.
Is there any chance you could do this without scripting??
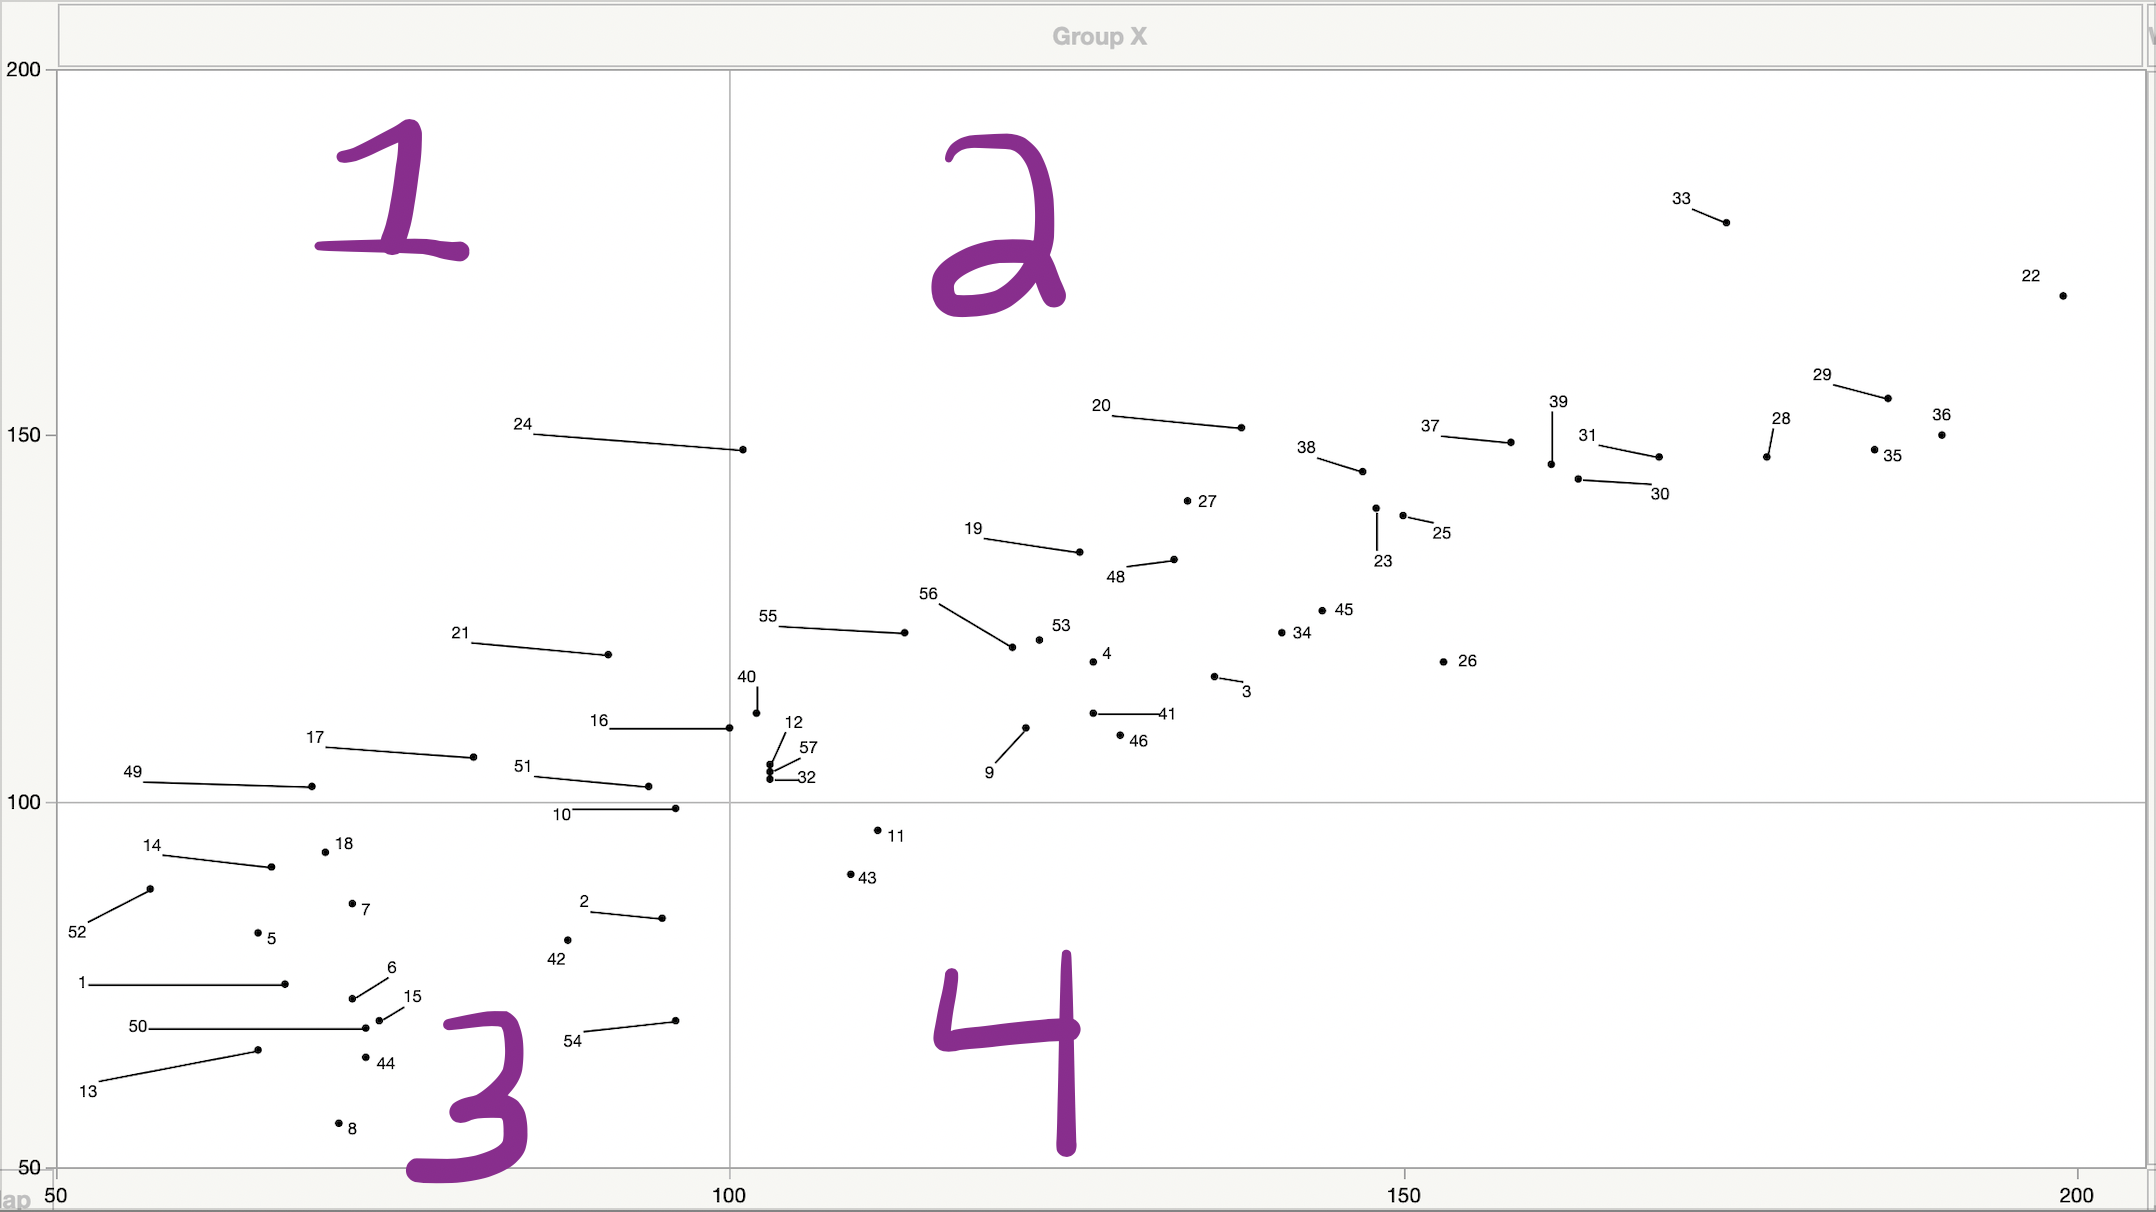
I have only done it partly using reference lines with overlapping (which I would like to avoid) - see the attached screenshot.
Have a nice day.
Technology Specialist
- Mark as New
- Bookmark
- Subscribe
- Mute
- Subscribe to RSS Feed
- Get Direct Link
- Report Inappropriate Content
Re: Custom background color to show quadrants in Graph Builder
There are a couple of ways that you can add items to your graphs.
Annotations
The Tool Bar above the JMP Display Window contains some icons that permit the adding of annotation items to graphs

Text, Arrows and Line, Polygons and Circles can be added. The are added on top of the graphics display.
You can also right click on the graph and choose "Customize" which allows for the addition of items using graphic primitives. While these use JSL, they are very simple to use and they allow you to add colored areas, text, lines, etc and they can be positioned at any level of the display.
- Mark as New
- Bookmark
- Subscribe
- Mute
- Subscribe to RSS Feed
- Get Direct Link
- Report Inappropriate Content
Re: Custom background color to show quadrants in Graph Builder
Thanks a lot for your reply. These are excellent tips and both make good sense.
Technology Specialist
Recommended Articles
- © 2026 JMP Statistical Discovery LLC. All Rights Reserved.
- Terms of Use
- Privacy Statement
- Contact Us