- Instantly extract effect sizes, F-ratios, and FDR-adjusted p-values from your models with the Calculate Effects Sizes extension, available now in the JMP Marketplace!
- New to JMP? Join us Sept. 23-24 for the Early User Edition of Discovery Summit, tailor-made for new users. Register now for free!
- Subscribe to RSS Feed
- Mark Topic as New
- Mark Topic as Read
- Float this Topic for Current User
- Bookmark
- Subscribe
- Mute
- Printer Friendly Page
Discussions
Solve problems, and share tips and tricks with other JMP users.- JMP User Community
- :
- Discussions
- :
- Comparing offset between curves

- Mark as New
- Bookmark
- Subscribe
- Mute
- Subscribe to RSS Feed
- Get Direct Link
- Report Inappropriate Content
Comparing offset between curves
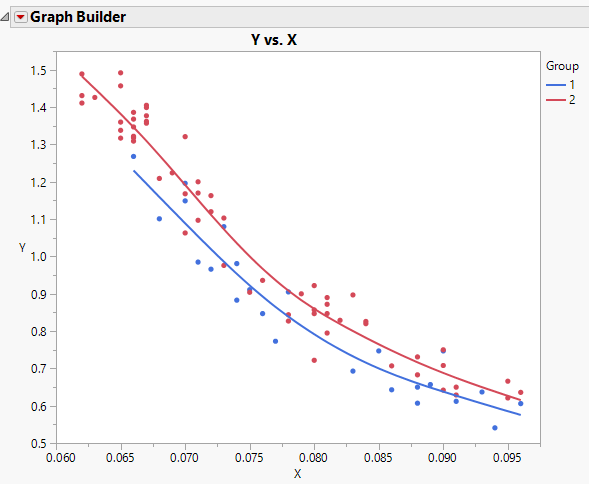
I have two populations of data on a Y-by-X plot. I want to quantify the difference between the two populations somehow, but have a couple of issues.
- The populations have different distributions of x-values, making it difficult to compare averages without chopping off some of the data.
- The trends curve, so I can't compare the equations easily.
Ideally, I'm looking for a way to quantify the 'average' difference in Y at a given X. Is there a way I can do this easily within JMP?
Y-by-X plot attached.

- Mark as New
- Bookmark
- Subscribe
- Mute
- Subscribe to RSS Feed
- Get Direct Link
- Report Inappropriate Content
Re: Comparing offset between curves
Here is a thought. Your curves look like they can be described quite well by a quadratic model. So have your data set up as 3 columns: Group, X, and Y.
Use Fit Model.
Y goes in as Y.
Build a model with effects for Group, X, X*X, Group*X, and Group*X*X.
Run the model and look at the parameter estimates.
The estimate for Group will give you the offset in the intercepts for the models.
The estimate for Group*X will give you the change in the slopes between the two models.
The estimate for Group*X* will give you the change in the quadratic terms between the two models.
By breaking it up this way, you have a better description of what and how the groups differ without having to explore EVERY possible X and calculating a difference. But, you could still do that by using the profiler. Place the slider for X at your desired location and look at the change in the Group profile.

- Mark as New
- Bookmark
- Subscribe
- Mute
- Subscribe to RSS Feed
- Get Direct Link
- Report Inappropriate Content
Re: Comparing offset between curves
Hi, here is one easy approach.
1) Right-click in your graph and select Smoother > Save Formula.
2) Look at the formula in the data table... it will have 2 "Spline Eval" pieces, one for each member in the group.... something like this:

3) Copy + paste each individual piece, so that it operates on all rows, not just rows belonging to a specific group, into a new formula column.
***** NOTE: this may involve extrapolation in your case, so heed the relevant interpretive cautions. Each formula will look something like this:

This will produce something like the last 2 columns, which I've named Curve 1 and Curve 2, in your table:

Next, compute the difference in these 2 columns, using a new formula column or a 1-click transform from within Graph Builder, and graph the difference column and the 2 formula columns you previously created vs. x, to view the results:

I've attached a table with illustrative table scripts and formula columns.
Cheers,
Brady
Recommended Articles
- © 2026 JMP Statistical Discovery LLC. All Rights Reserved.
- Terms of Use
- Privacy Statement
- Contact Us