- Subscribe to RSS Feed
- Mark Topic as New
- Mark Topic as Read
- Float this Topic for Current User
- Bookmark
- Subscribe
- Mute
- Printer Friendly Page
Discussions
Solve problems, and share tips and tricks with other JMP users.- JMP User Community
- :
- Discussions
- :
- Change y axis in graph builder
- Mark as New
- Bookmark
- Subscribe
- Mute
- Subscribe to RSS Feed
- Get Direct Link
- Report Inappropriate Content
Change y axis in graph builder
Hello everyone,
I'm a student and new here.
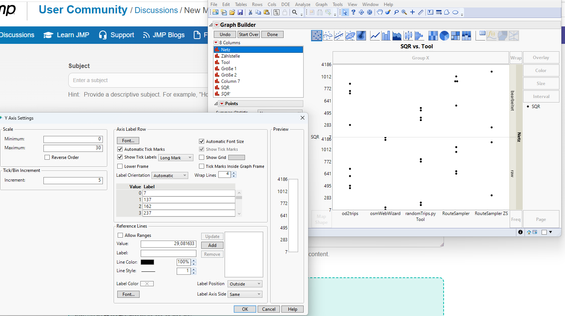
I want to plot points in the graph builder. Unfortunaly I'm not able to change the y axis to a linear scale, like i would get it if I plot it in word for example.
What I mean is, I want 500, 1000, 1500,... for the labels instead there are the values of the data points I plot
Here is how it looks like:
Thanks in advance
Flo
- Tags:
- windows
Accepted Solutions
- Mark as New
- Bookmark
- Subscribe
- Mute
- Subscribe to RSS Feed
- Get Direct Link
- Report Inappropriate Content
Re: Change y axis in graph builder
Try changing your modelling type to Continuous instead of Nominal. In JMP correct modelling type (and data type) do matter a lot. You can do this by right-clicking on the red bar chart next to column name. If continuous is disabled your data isn't numeric data and you have to first fix that (example of this below)
Recommended Articles
- © 2026 JMP Statistical Discovery LLC. All Rights Reserved.
- Terms of Use
- Privacy Statement
- Contact Us


