- Subscribe to RSS Feed
- Mark Topic as New
- Mark Topic as Read
- Float this Topic for Current User
- Bookmark
- Subscribe
- Mute
- Printer Friendly Page
Discussions
Solve problems, and share tips and tricks with other JMP users.- JMP User Community
- :
- Discussions
- :
- Box plot - boite à moustache
- Mark as New
- Bookmark
- Subscribe
- Mute
- Subscribe to RSS Feed
- Get Direct Link
- Report Inappropriate Content
Box plot - boite à moustache
Bonjour,
Je suis Néophyte en JMP.
J'ai des séries de concentration associées à différents régimes moteurs. J'ai utilisé le tableur est dans chaque colonne j'ai mis les concentrations pour un régime donné.
J'ai réussi à obtenir une représentation en boite à moustache en utilisant la fonction distribution. Néanmoins, la présentation n'est pas optimale pour une publication, car si j'exporte les graphiques je n'ai pas les légendes pour l'échelle des y. Je souhaiterais utiliser la fonction y en fonction de x pour avoir en y les concentrations et en x la liste des différents régimes moteur qui correspondent pour l'instant au titre de mes colonnes. Pouvez-vous m'indiquer comment créer facilement cette nouvelle liste dans le tableur pour pouvoir construire mon graphique xy et avoir toutes les boites à moustache sur un seul graphique ?
Merci par avance.
- Mark as New
- Bookmark
- Subscribe
- Mute
- Subscribe to RSS Feed
- Get Direct Link
- Report Inappropriate Content
Re: Box plot - boite à moustache
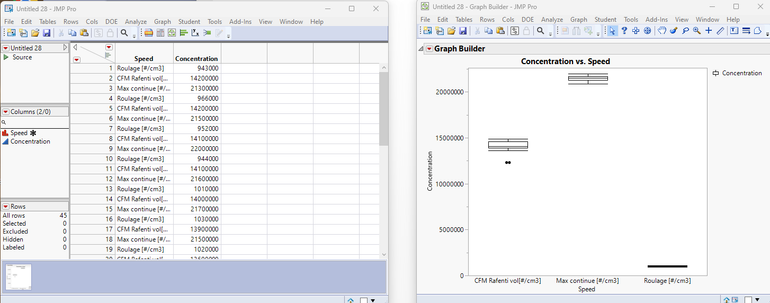
Is this the form of the graph that you are looking for?
If it is, all I did was to stack the columns
Tables=<Stack
and then use Graph Builder to build the presentation
- Mark as New
- Bookmark
- Subscribe
- Mute
- Subscribe to RSS Feed
- Get Direct Link
- Report Inappropriate Content
Re: Box plot - boite à moustache
Thank you very much, that's exactly what I'd like to do.
Recommended Articles
- © 2026 JMP Statistical Discovery LLC. All Rights Reserved.
- Terms of Use
- Privacy Statement
- Contact Us

