cancel
Showing results for 
Show  only  | Search instead for 
Did you mean: 
  • New to JMP? Join us Sept. 23-24 for the Early User Edition of Discovery Summit, tailor-made for new users. Register now for free!
  • Use World Cup data to build models, explore spatial relationships, and create informative visualizations in JMP. Register. July 17, 2 pm US Eastern Time.
  • Your voice matters! Tell us how you prefer to receive JMP updates, so we can tailor our communication to your needs. Take short survey.

Discussions

Solve problems, and share tips and tricks with other JMP users.
Choose Language Hide Translation Bar
itzikd
Level II

Adding moving Average to a bivariate graph

Hello,

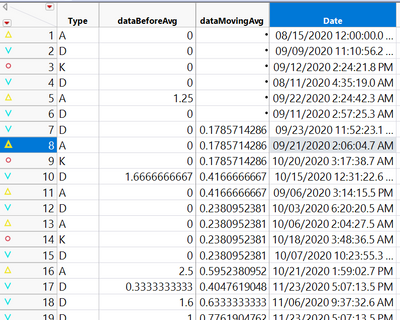
my data table looks something like this:

dataBeforeAvg = data

dataMovingAVG = calculate moving average 7 days back (based on dataBeforeAvg column)
itzikd_2-1615460291535.png

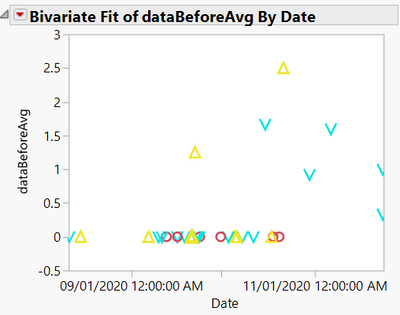
doing fit x by y graph I have a graph with regular dataBeforeAvg on Y and date on X
itzikd_0-1615460131894.png

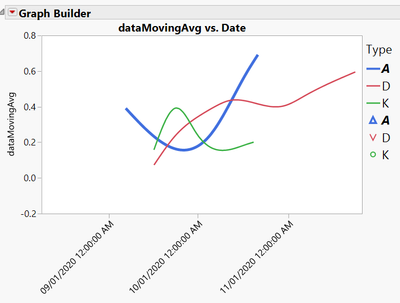
what I want to do is take the moving AVG line and stick it on the graph above
itzikd_1-1615460220343.png


is this possible in JMP 12?


1 REPLY 1

Re: Adding moving Average to a bivariate graph

Why not go the other way and show the Points elements in Graph Builder?

Recommended Articles

