- Learn how to build custom Python data connectors and further customize JMP’s Data Connector Framework with the Python Data Connector Demo, available now in the JMP Marketplace!
- See how to move from signal modeling to system modeling at the first JMP Aerospace Analytics webinar. Register. June 18, 1 p.m. US Eastern Time.
- Subscribe to RSS Feed
- Mark Topic as New
- Mark Topic as Read
- Float this Topic for Current User
- Bookmark
- Subscribe
- Mute
- Printer Friendly Page
Discussions
Solve problems, and share tips and tricks with other JMP users.- JMP User Community
- :
- Discussions
- :
- ANOVA with repeated measures factors

- Mark as New
- Bookmark
- Subscribe
- Mute
- Subscribe to RSS Feed
- Get Direct Link
- Report Inappropriate Content
ANOVA with repeated measures factors
Hello,
I want to build a model for analyzing the results of an experiment I performed, the structure of the experiment as shown in the picture.

I have two treatments, each treatment contains 5 hives, from each hive I chose 6 bees, I gave each bee a task that she performed 8 trials.
I measured the time required to perform each trial.
I consider bees and hives as random effect, each trial as repeated measure, and maybe even every bee as repeated measure of the hive (I'm not sure how to deal with it).
I would appreciate advice on building the right model, if so I don't want to use MANOVA.
Thanks.

- Mark as New
- Bookmark
- Subscribe
- Mute
- Subscribe to RSS Feed
- Get Direct Link
- Report Inappropriate Content
Re: ANOVA with repeated measures factors
Hi @Erez,
I think what may be good first before building a model may be to assess the repeatability/reproducibility of your trials, to check if your signal is more important than the "noise" of the measurements.
When looking at your results with the platform "Variability Gauge Chart" (script 1., with "bee" as the "Part, Sample ID", and "treatment" and "hive" as "X, Grouping" variables, "time" as "Y, Response" and choosing Nested as model type), I can see some very interesting informations :
- Looking at the variance components, 58% of the variability comes from repeatability, 25,6% from part-to-part (bee) and 16,4% from reproducibility. So that is a first indication that there is a lot of variance on the measurement.
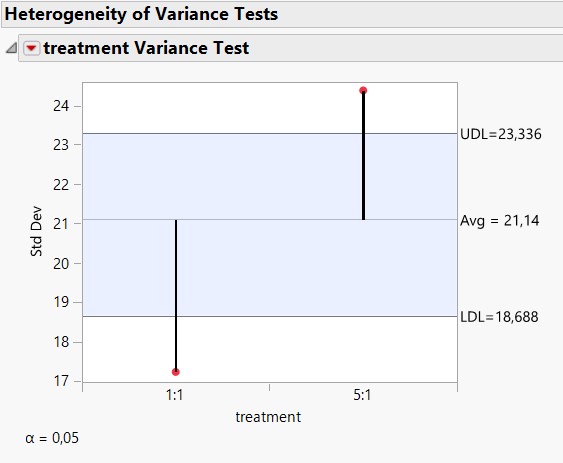
- Looking at heterogeneity of variance tests, we can see that "treatment" has a variance different depending if it is treatment 1:1 or 5:1. So there might be someting to search for later here.
- Looking at the Gauge R&R Mean Plot, we can see a slight increase of time depending on treatment. Another clue that something might be interesting to search here.
So looking now at the "Fit Y by X" platform, you can try the hypothesis that the reaction time for bees will be different depending on the treatment. There are two options here :
- Do the analysis with time as Y and treatment as X (script 2.1), check that the variances are equal (they're not), and choosing a non-parametric test since the distributions are not normally distributed, and you'll end up with Wilcoxon test showing a significant p-value : there is a significant difference in time depending on the treatment.
- Do the analysis with log(time) as Y and treatment as X (script 2.2), this time variances are equivalent and distributions are normally distributed, so you can do a Student t-test and once again see a significant p-value.
I think these first analysis may be useful before starting to model the whole process.
I have saved the scripts in your JMP data table to do the analysis I have described.
Hope this will help you for the beginning of your project,
"It is not unusual for a well-designed experiment to analyze itself" (Box, Hunter and Hunter)

- Mark as New
- Bookmark
- Subscribe
- Mute
- Subscribe to RSS Feed
- Get Direct Link
- Report Inappropriate Content
Re: ANOVA with repeated measures factors
Hi @Erez ,
You may try this as a first attempt: Full Factorial Repeated Measures ANOVA Add-In
otherwise, from my experience with measuring time for animals to perform tasks, there is always an issue of distribution. is it capped? did they all complete the task? do you treat it as "time to event"?
let us know if we are in the right direction.
Ron

- Mark as New
- Bookmark
- Subscribe
- Mute
- Subscribe to RSS Feed
- Get Direct Link
- Report Inappropriate Content
Re: ANOVA with repeated measures factors
Hi @Erez ,
thanks for providing comprehensive information on your case, this helps a lot to get good answers from the community.
In addition to answers before, I always like to just play visually with the data before putting it into a more complex model (like Fit y by x, i.e. time by all other columns).
To me it looks that there is a clear dependence of time on trial, it means there is a learning curve. So this is not just repeated measurement with the same expected value. It may be an option to put trial into the model, or to filter last three trials to evaluate result for trained bees etc.

- Mark as New
- Bookmark
- Subscribe
- Mute
- Subscribe to RSS Feed
- Get Direct Link
- Report Inappropriate Content
Re: ANOVA with repeated measures factors
Thank guys, yours advice helps me a lot (especially Victor_G which emphasizes his steps, since I am not an expert in JMP).
Regarding bee complete the task, I will have to give more details.
The bee enters to room with 8 artificial flowers, I defined visit in all the flowers as success at task.
Finding the first flower occurs almost immediately, finding the last flower is the most difficult because there is a high chance the bee will reach to flower that she already visited (The amount of reward in each flower is very small so the bee eventually will go through all the flowers before returning to the hive).
All the events are recorded so I can know when the bee reach the first flower, second etc.
Because reaching the last flower is the most difficult, there is a lot of "noise" in the measurement.
The data I provided at the beginning shows the time it took to reach flower number 7, now I also added the time to reach flower 6.
In general it seems that there is learning from trial to trial.
I'm interested to search if there is a difference between the treatments, the difference can be the time that required to complete the task or difference in the variance between groups (maybe your suggestion on what to look for).
Thank.
- Mark as New
- Bookmark
- Subscribe
- Mute
- Subscribe to RSS Feed
- Get Direct Link
- Report Inappropriate Content
Re: ANOVA with repeated measures factors
Hi @Erez ,
in the past we had this discussion Repeated measures survival analysis
it may have some useful insights depending on how you see the data in hand.
in addition, would it be useful to also analyze the data as count (number of flowers)? could it possibly have a Poisson distribution? Gamma distribution?
perhaps @peng_liu has a useful way of looking at this.

- Mark as New
- Bookmark
- Subscribe
- Mute
- Subscribe to RSS Feed
- Get Direct Link
- Report Inappropriate Content
Re: ANOVA with repeated measures factors
Thanks for notifying me, @ron_horne This data is interesting. I am wondering whether the trial ID means anything. I attach a modified data table, with "trial" treated as numerical, continuous. I added one column, which calculates the difference of time7 and time6. I added 4 graph builder scripts.
Here is the first plot, time6 vs trial ID, by hives, colored by treatments.

Below is the second plot. The same thing, but I fitted simple straight lines for every bee.

If trial ID actually means the order, these are interesting plots to me. They may represent what you mean by "In general it seems that there is learning from trial to trial." Smart bees :)
Recommended Articles
- © 2026 JMP Statistical Discovery LLC. All Rights Reserved.
- Terms of Use
- Privacy Statement
- Contact Us