This website uses Cookies. Click Accept to agree to our website's cookie use as described in our Privacy Policy. Click Preferences to customize your cookie settings.
- JMP User Community
- :
- Blogs
- :
- Daniel Valente
- :
- Preview of 2015 Discovery Summit Presentation on Best Practices for Producing Hi...
Turn on suggestions
Auto-suggest helps you quickly narrow down your search results by suggesting possible matches as you type.
Article Options
- Subscribe to RSS Feed
- Mark as New
- Mark as Read
- Bookmark
- Subscribe
- Printer Friendly Page
- Report Inappropriate Content

Staff
Preview of 2015 Discovery Summit Presentation on Best Practices for Producing High Quality Graphics out of JMP
Created:
Aug 3, 2015 10:20 AM
JMP Discovery Summit 2015 is coming up soon in San Diego. I'm presenting a paper on Best Practices for Producing High-Quality Images of Your JMP® Graphs and Analyses for Presentation and Publication. It's during one of the breakout sessions on Tuesday. This paper is based on a series of blog posts I've written in the past few years on the main JMP blog regarding producing high-quality graphs and reports from JMP for print or presentation.
The point of this blog post is two-fold. First, with a quickly-approaching deadline, it's time to organize my thoughts and put down exactly what I will present and hopefully get some early feedback on the major topic areas that I will discuss. With only a 30-minute paper slot (that should include 5 minutes for questions at the end), I won't be able to cover everything, but I do want to cover the areas where people seem to have the most trouble most of the time.
So here are the five topics I plan on covering.
1. PowerPoint Export (New in JMP 12) -- JMP 12 introduced a great tool that allows for pain-free export of JMP graphs and reports directly into Microsoft PowerPoint. In addition to the one-click export, this feature solves one of the biggest graphical output pains that users have, which is getting vector images out of JMP. Vector images can be resized or scaled easily without losing clarity or quality. And getting your JMP graphs into PowerPoint is easy. File > Save As will now give you the option of saving as a PowerPoint presentation (.pptx). Make sure you keep the default EMF Graphics File Format checked and you will have your graphics in a vector format automatically.
So here is the resulting PowerPoint presentation:
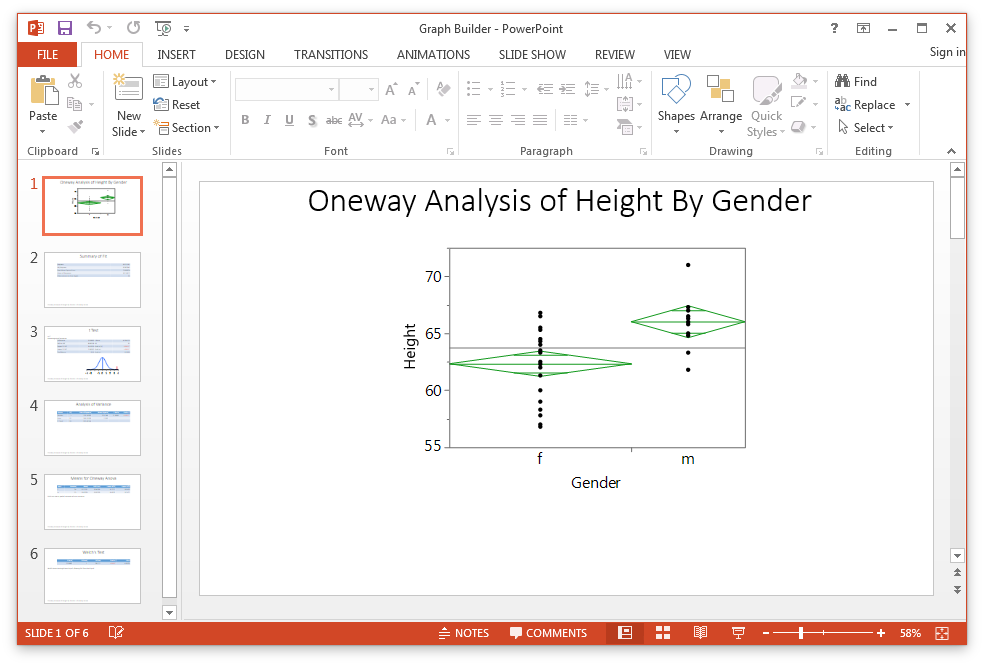
There are a couple of nice attributes of this (In addition to the fact that the graph is in a proper vector format). 1) Backgrounds are white 2) the font size/graph size ratio is nice 3) extraneous UI elements and boxes are removed from the graph. Better still, we can right-click on the graph and select "Save as Picture", as shown below:
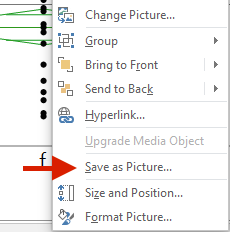
This gives me the ability to save this out as an .EMF file that can be opened up in image editing software like Adobe Illustrator for further tweaking or customization. I also have the option in PowerPoint to Right Click > Edit Picture, which will convert the .EMF into a Microsoft Office drawing object. Once in a drawing object, the graph can be ungrouped through Right Click > Group > UnGroup. Now every single element on the graph can be customized and edited. There is a lot of power here, and this single-click export to PowerPoint has really helped with the workflow.
On the presentation-side of things, I also plan on covering how to customize the default template used by JMP in order to use your organization's PowerPoint template. This is something I shared a few weeks ago that Gail@jmp mentioned on this discussion forum post.
2. Apple® Keynote Export -- For many Mac users, Keynote is the presentation tool of choice. Fortunately, the Save as PowerPoint presentation in JMP plays nice with Keynote. On the Mac version of JMP, select File > Export > Microsoft PowerPoint. Then simply open the presentation in Keynote. Additionally, you can always use Copy/Paste to get graphs and charts into existing PowerPoint or Keynote presentations. This works better with the Copy Without Background Add-In, which I'll cover next.
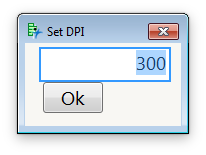
3. Useful Add-Ins -- I plan on covering several useful Add-Ins that I use to help with graphical output workflow. I often use julian's Plot Defaults and Copy Without Background Add-Ins. I also have a Set Default DPI Add-In that BradyBrady helped me put together. This lets me adjust the DPI that JMP uses as its default when you File > Save As or Edit > Save Selection As. This is useful when you need a high-resolution raster image for print (I do this a lot when taking screenshots, which will be printed on large things such as posters or booth properties).
4. Workflows for creating vector Images on Mac and Windows -- While the PowerPoint export is a useful way for getting nice output from JMP easily, I wanted to also review the workflow for creating high-quality graphs in vector format on both the Mac and Windows versions of JMP without the use of PowerPoint.
- For Mac, I'll talk about using the selection tool to grab the graph of interest, then CMD-C to bring it onto the clipboard. Then open Apple® Preview, CMB-N (New from Clipboard). Save As. Now your Graph is in a vector format. The Copy Without Background Add-In let's you remove the tan background color without need to change your preferences in JMP.
- For Windows, simply select the items in the report that you want to export, Edit > Save Selection As. Choose .EMF. Now your Graph is in a vector format.
5. High-Resolution Raster Images (Windows) -- Finally, I'll work through setting the resolution of raster images when saving graphs out in Windows using the Set DPI Add-In and also through the preferences.
So that is kind of my plan. I'd love to hear your comments and feedback. Are there other pains your have trying to get graphs and reports out of JMP and into publication or presentations? Is there anything else I should cover here?
See you at Discovery Summit 2015!
Comments
You must be a registered user to add a comment. If you've already registered, sign in. Otherwise, register and sign in.
- © 2024 JMP Statistical Discovery LLC. All Rights Reserved.
- Terms of Use
- Privacy Statement
- About JMP
- JMP Software
- JMP User Community
- Contact