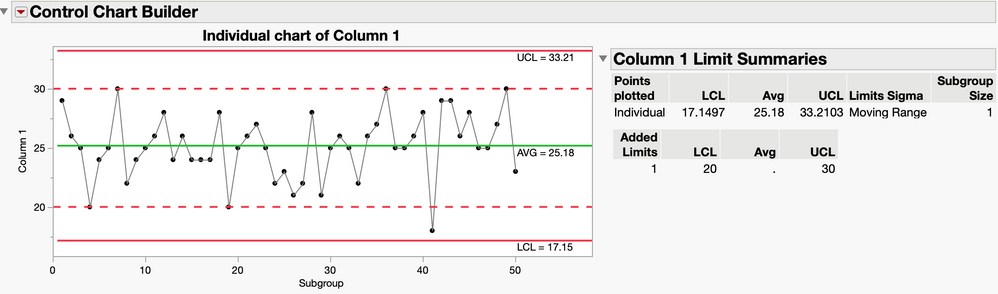
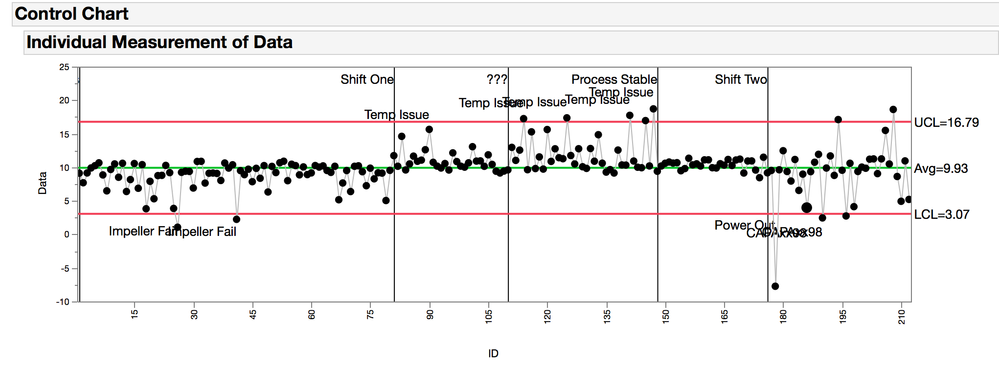
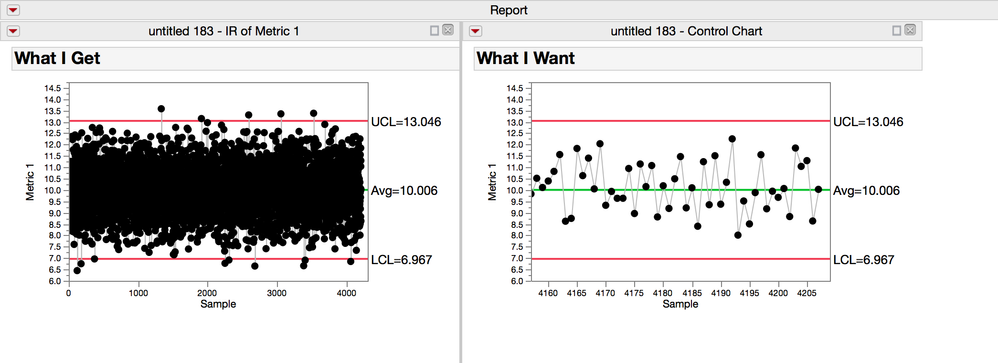
Old and New Control Limits on the Same Control Chart
I run into a problem where I want to see what my old control limits would look like relative to the current or new fixed control limits for a set of control charts. Typically, I'd g...
Byron_JMPI run into a problem where I want to see what my old control limits would look like relative to the current or new fixed control limits for a set of control charts. Typically, I'd g...
Byron_JMPThis is the journal and presentation materials for Session 4 of the Pharma and Biotech Data Discovery Series, Summer 2020 The topic of this session is: Chemistry Manufacturing and Con...
Byron_JMPThis journal provides background for thinking about DOE design and analysis. A key component is the DOE Walkthrough. It is a step-by-step guide for setting up your first DOE. Its very similar...
Byron_JMPMultiple Y-Axis with a Scaled Response Overlay Graph STOP! If you just want the script, it is attached at the bottom of the post. This is a specialized...
Byron_JMPI'm not sure what the most proper name for the format of data is, but I refer to it as, "multiple boxes". In this format each reading of the plate is output into a grid. or box with the row and...
Byron_JMPSometimes specification limits and control limits are too limiting and I need another kind of limit type, like for example when I'm working with environmental monitoring da...
Byron_JMPImagine if you had a system that could execute a set of experiments in a nearly automated way, like maybe a hight throughput assay system. Wouldn't it be nice if you could just send tables of factors...
Byron_JMPIn Pharma and Biotech, there was a time when "foils" and 35mm slides were the standard for presentations. Most of the time these slides had dark backgrounds and light colored text and figure...
Byron_JMPThe Nominal Logistic Regression Report has a Profiler for showing the probability of a binomial outcome as a function of your model effects. This is a great figure, but when its exported u...
Byron_JMPCycle Markers for Clinical Trial Data Scripted solution and Add-in for taper down cycles In some trials a subject receives a series of doses that are tapered from high to low. D...
Byron_JMPGetting started with scripting can feel daunting at first. I've assembled a couple of links that might help you get started. The first one is a recording from a discovery talk a couple of ...
Byron_JMP...ata; it is however, the best aggregation of publicly available data (in English) that I know of. If you have something better, please let me know. Its not my data. The folks at Johns Hopkins U...
Byron_JMPEver since scientists started using ANOVA, the result have been represented with a bar chart for each treatment, and one-sided wisker above the plot to represent the 95% confidence interval*...
Byron_JMPEvent Lines and Comments on Control Charts Annotating control charts with known events? I’m continuously running into situations where I need to add event lines to a graph. These are disti...
Byron_JMPSuppose you characterized the variation in the weight of tablets from a new process and then wanted to use that work to estimate the variation in weight that could be expected in a multi-tablet packa...
Byron_JMPImagine I have a multi-step process, like maybe an additive dispense process, where I'm using well characterized pumps to deliver set volumes to container and then at the end I check the mass of the ...
Byron_JMPRandal Munroe publishes one of my all time favorite comics, xkcd. Last week's comic was on curve fitting, and was, arguably kind of hilarious. @Randal Munroe, dude you're hilar...
Byron_JMP...f the Open Government Initiative that stated in 2009, the FDA began to provide the public with some of the finding and results from the site inspections. The goal was to help improve the public u...
Byron_JMPThis isn't so much a complete idea as it is a starting point for a discussion. I recieved some data in a format like this: Column Headers: Res, ID, L1, L2, L3..., M1, M2, M3... Each ...
Byron_JMPHow to generate control charts that only show the last 50 rows of data In the figure above, on the left, the default chart with all the data from my table and on the right is a chart from the ...
Byron_JMP