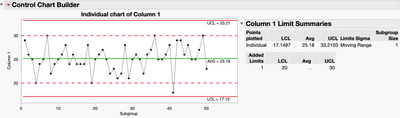
I run into a problem where I want to see what my old control limits would look like relative to the current or new fixed control limits for a set of control charts. Typically, I'd go about adding reference lines to each graph, but I think there might be a better way, using a long forgotten (at least to me) platform message.
Earlier this year I was playing around with the idea of what it would look like to add a new column property, in this case Action and Alert Limts for environmental monitoring charts, and then use that column property as a reference line in control charts.
While I was looking for something completely different in the Scripting Index, I ran across a function called "Add Limits". As far as I can tell, this function has been around for a long time, before JMP 14 at least, and it can be used to send Upper and Lower Control Limits to a control chart. These limits are displayed as dashed lines, and they are listed in a table alongside the graph. It would take me a lot of JSL to get that to happen, so it’s nice to discover such a highly useful utility..
The basic usage of "Add Limits" looks something like this, where the last line of JSL sends a message to the chart that includes the values to use as the dashed line limits.:
//Example of adding limits to a control chart
ccb = dt << Control Chart Builder( Variables( Y( :Column 1 ) ), Show Control Panel( 0 ) );
ccb << chart( position( 1 ), Add Limits( {LCL( 20 ), UCL( 30 )} ) );
Of course, I'd want to use "Add Limits" dynamically with any column, so that takes a little extra bit of fancy foot work.
First, let's set up a table to used as an example. Note that while setting up the table I delete the formula that generates some random data to work with right after the table is constructed. This fixes the values in the table.
dt=New Table( "old and new control limits",Add Rows( 50 ),
	New Column( "Column 1",Numeric,"Continuous",Format( "Best", 12 ),
	Formula( Round( Random Normal( 25, 3 ), 0 ) )));
column(dt, 1)<< Delete Formula;
The next step is to add a new kind of column property, something custom that doesn't natively exist in JMP. After running this line, the column in the data table now has a property called Old Control Limits.
Column( dt, 1 ) << set property( "Old Control Limits", {LCL( 20 ), UCL( 30 )} );
Then, just to check to see if the script worked you can get a look at the values from the column property. The new variable, OCL, has two values, LCL(20), and UCL(30). I can use those values in a new control chart:
OCL = Column( dt, 1 ) << Get Property( "Old Control Limits" );Show( OCL[1], OCL[2] );
The next couple of lines might look really odd, but they are super robust and take advantage of function based structure of JSL.
First, I'm going to define a couple of empty or nearly empty arguments and then I'm going to nest them together. By setting up these expressions I can handle each part without evaluating them. ccbe, the control chart builder expression is a function, Control Chart Builder with two arguments, Variables and Show Control Panel.
Next, I want to add a new argument called chart() to the Control Chart Builder function.
- The new variable, ce is an expression with the argument chart and chart includes an argument, position (1).
- I want to add, add limits to the chart argument so I have variable ae, to reference an empty add limits expression.
- Last I make an empty list called le, which will contain the limits I got from Get Property in the OCL variable from the previous step.
ccbe = Expr(Control Chart Builder( Variables( Y( :Column 1 ) ), Show Control Panel( 0 ) ));
ce = Expr( chart( position( 1 ) ) );
ae = Expr( add limits() );
le = {};
Then, I layer the pieces together to do this:
- First, I take the list of things in OCL and insert it into le.
- Second, I take le and insert it into ae, followed by inserting ae into ce. In the second case I wrapped ae inside a Name Expr(). This gives me the evaluated expression of ae without evaluating it. This NameExpr() method is super handy.
- Third, I insert ce into the ccbe, which is the whole control chart expression.
- I also included a Show after each step so you can see how the function is being built in the log.
- The last step is to get a graph. By just running ccbe all alone, that variable holding the complete expression gets evaluated, and I get a control chart with dashed lines representing the old control limits, which came from the columns properties
Insert Into( le, OCL );show( le );
Insert Into( ae, le );Show( ae );
Insert Into( ce, Name Expr( ae ) );Show( ce );
Insert Into( ccbe, Name Expr( ce ), 2 );
ccbe;
With a little more effort, I'm pretty sure it would be possible to start with a table that includes the current and old control limits, which could be used to populate all the column properties for a whole table of process variables.
The entire script is attached.

