JMP에서 한반도 지도를 이용하기 위해선 위/경도 좌표 데이터가 필요합니다. 인터넷을 찾아보면 많은 정보가 나오지만, 여기에선 다음 링크에서 획득한 위/경도 좌표를 쓰기로 합니다. 대한민국 주요 도시 위/경도 자료
예를 들어 서울의 위/경도 좌표는 다음과 같이 두가지 형식으로 표현될 수 있으나, JMP에서는 위도/경도별 각 3가지 좌표포맷을 지원합니다.

위 데이터를 JMP Data Table에 입력한다고 가정하면, 다음과 같은 과정을 거쳐야 합니다.
1. Insert Column >> 위도(Latitude) / 경도(Longitude)
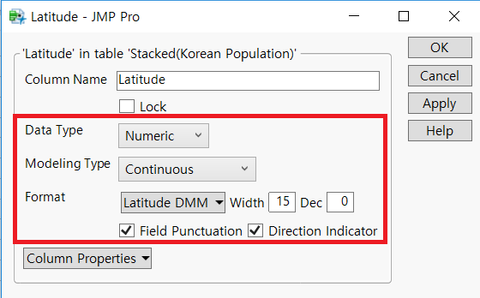
2. Column Property 설정 >> Column Info에서 Data Type은 Numeric, Modeling Type은 Continuous, Format은 Latitude DMM으로 설정(물론 Latitude DDD / DMS로도 설정 가능)합니다.

다만, 입력을 하실 때 37° 34’ 00” N(인터넷 자료에서 마우스로 긁은 후 Copy&Paste)를 입력하시면 JMP에서 제대로 인식을 하지 못 합니다. 37° 34’ 00” N 이 부분을 37° 34' 00'' N으로 로 변경(분/초 입력을 키보드의 따옴표로 변경하셔야 합니다)해서 입력하시거나, 37.56667을 입력하시면 JMP에서 제대로 인식을 하게 됩니다.
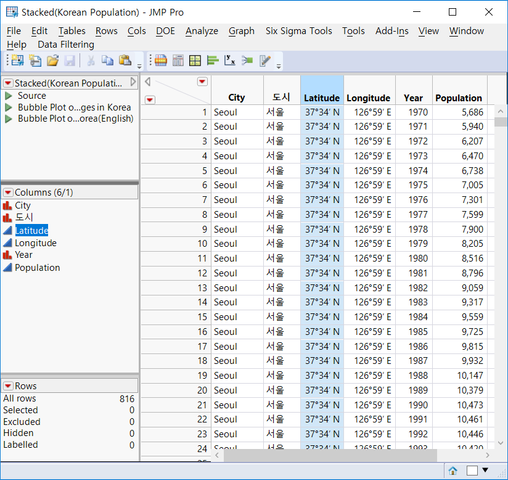
아래 보시는 JMP Data Table은 주요도시(영문/국문), 위/경도, 년도, 인구수(단위 : 천명) Data이며 위/경도 Data가 제대로 인식되어 있음을 확인하실 수 있습니다(관련 데이터 테이블은 첨부파일을 참고하세요). 아래 데이터를 통한 분석내용은 다음 링크를 참조바랍니다.
1970년 이후 대한민국 주요도시의 인구변화

자. 이제 위/경도 데이터가 준비되었으니 JMP Graph Builder를 통해 한반도 지도를 적용해 보겠습니다.
Graph Builder 메뉴를 클릭, Y축에는 위도(Latitude), 그리고 X축은 경도(Longitude)를 드래그하신 후, 도시를 Overlay에 놓습니다. 아레 그림은 도시를 Marker로 사용한 사례입니다. Marker로 사용하지 않으면 동그라미만 그려지고 우측에 범례가 표시됩니다.
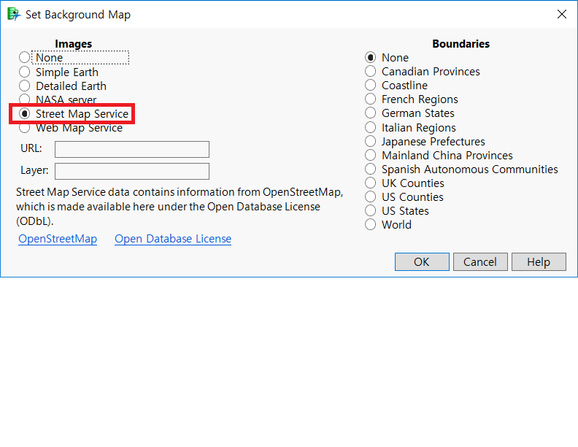
그리고 위에서 설명드렸듯이 JMP에서 제공하는 여러가지 Background Map이 있으나, 아래 이용한 map은 Street Map Service입니다. 제가 보기엔 가장 가독성이 좋았습니다.

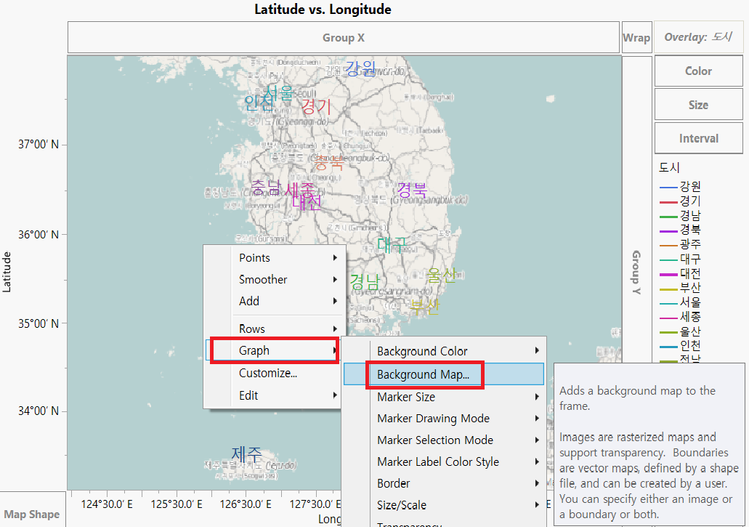
※ 참고 : Background Map 설정방법

위와 같이 Background Map을 선택 후 아래에서 Street Map Service 선택

Stacked(Korean Population).jmp
You must be a registered user to add a comment. If you've already registered, sign in. Otherwise, register and sign in.